
VERTEx
A performance tracking app that utilises a groundbreaking technology.
Timeline
November 2022 - December 2022
My Role
Lead UX/UI Designer — Research, Visual Design, Interaction Design, Prototyping
Overview
Athlete tracking is a vital part of most sports, from grass-roots to professional level. The data collected holds the power to elevate performance, improve competitive advantage and engage fans.
In football specifically, athlete tracking currently relies on wearable sensors, these carry a host of pain points surrounding data type limitations and accuracy. Now, through AI, we are about to witness a revolution in the athlete tracking market.
Skills Developed
Figma
Wireframing
UIs for mobile and web
Prototyping and animation
Usability testing
Research
Communication with developers
RESEARCH
Game-changing insights.
The Performance Tracking Market
Lower cost solutions
Currently, the quality and quantity of wearable trackers required results in significant levels of investment.
Greater precision
Existing technologies provide valuable data, however, due to currently technology limitations, an abundance of key data is yet to be exploited.
Integration with other technologies
Many performance tracking solutions exist as standalone products, without integrating with other technologies or platforms and only benefiting those who operate the technology.
A User's Perspective
User-friendly interfaces
Many performance tracking solutions have complex interfaces that can be difficult for users to navigate and understand.
Access to data
Currently, consumers cannot openly access this pool of performance tracking. The data not only holds the ability to fascinate and increase engagement, but also inform decisions in the giant markets of gambling and fantasy sports.
SPATIAL AI
A new age of sports data.

Spatial AI allows computers to see the world as humans do, but better. Using high-resolution cameras, depth vision and on-chip machine learning, intelligent and accurate analytics are recorded. This highly demanded data can then be diffused live and recorded for athletes, performance analysts and the data hungry public.
What data can be recorded?
Familiar speed, distance, location, power movement and timing measurements we get from current wearables
Gameplay intelligence metrics
Receptions behind midfield and defensive lines
Expected goals (xG)
Ball recovery time
Forced turnovers
Defensive line height
Attacking, midfield and defensive units
Team lengths
Pressure on the ball
Final third entries
Line breaks
Biomechanics tracking for injury prevention
TARGET AUDIENCE
Who's in the game, And why.
Athletes and Coaches
Player Performance Analysis
Data surrounding athlete performance can offer valuable insights. The data can be analysed to identify areas of training and performance that need optimisation.
User Engagement
Fans love data-driven insights and analysis. The provision of real-time telemetry data means fans can be engaged in new and exciting ways.
Competitive Advantage
Using advanced analytics means that teams can identify patterns and trends faster and more effectively. This can help teams develop game tactics, adjust training programs and optimise overall performance.
Revenue Generation
The technology brings more potential for revenue generation through avenues such as user engagement, sponsorship and success on the pitch.
Consumers
Enhanced Fan Experience
Vertex provides real-time data on player performance directly to consumers. This data can enhance the fan experience by providing a greater level of insight into the game.
Fantasy Sports
By analysing the valuable performance data, fantasy sports fans can inform their decisions with much greater precision.
Betting
Bettors can also utilise the data to analyse athlete performance and game trends, increasing the likelihood for accurate decisions.
THE DESIGN PROCESS
Where problem solving and creativity meet.

User Persona
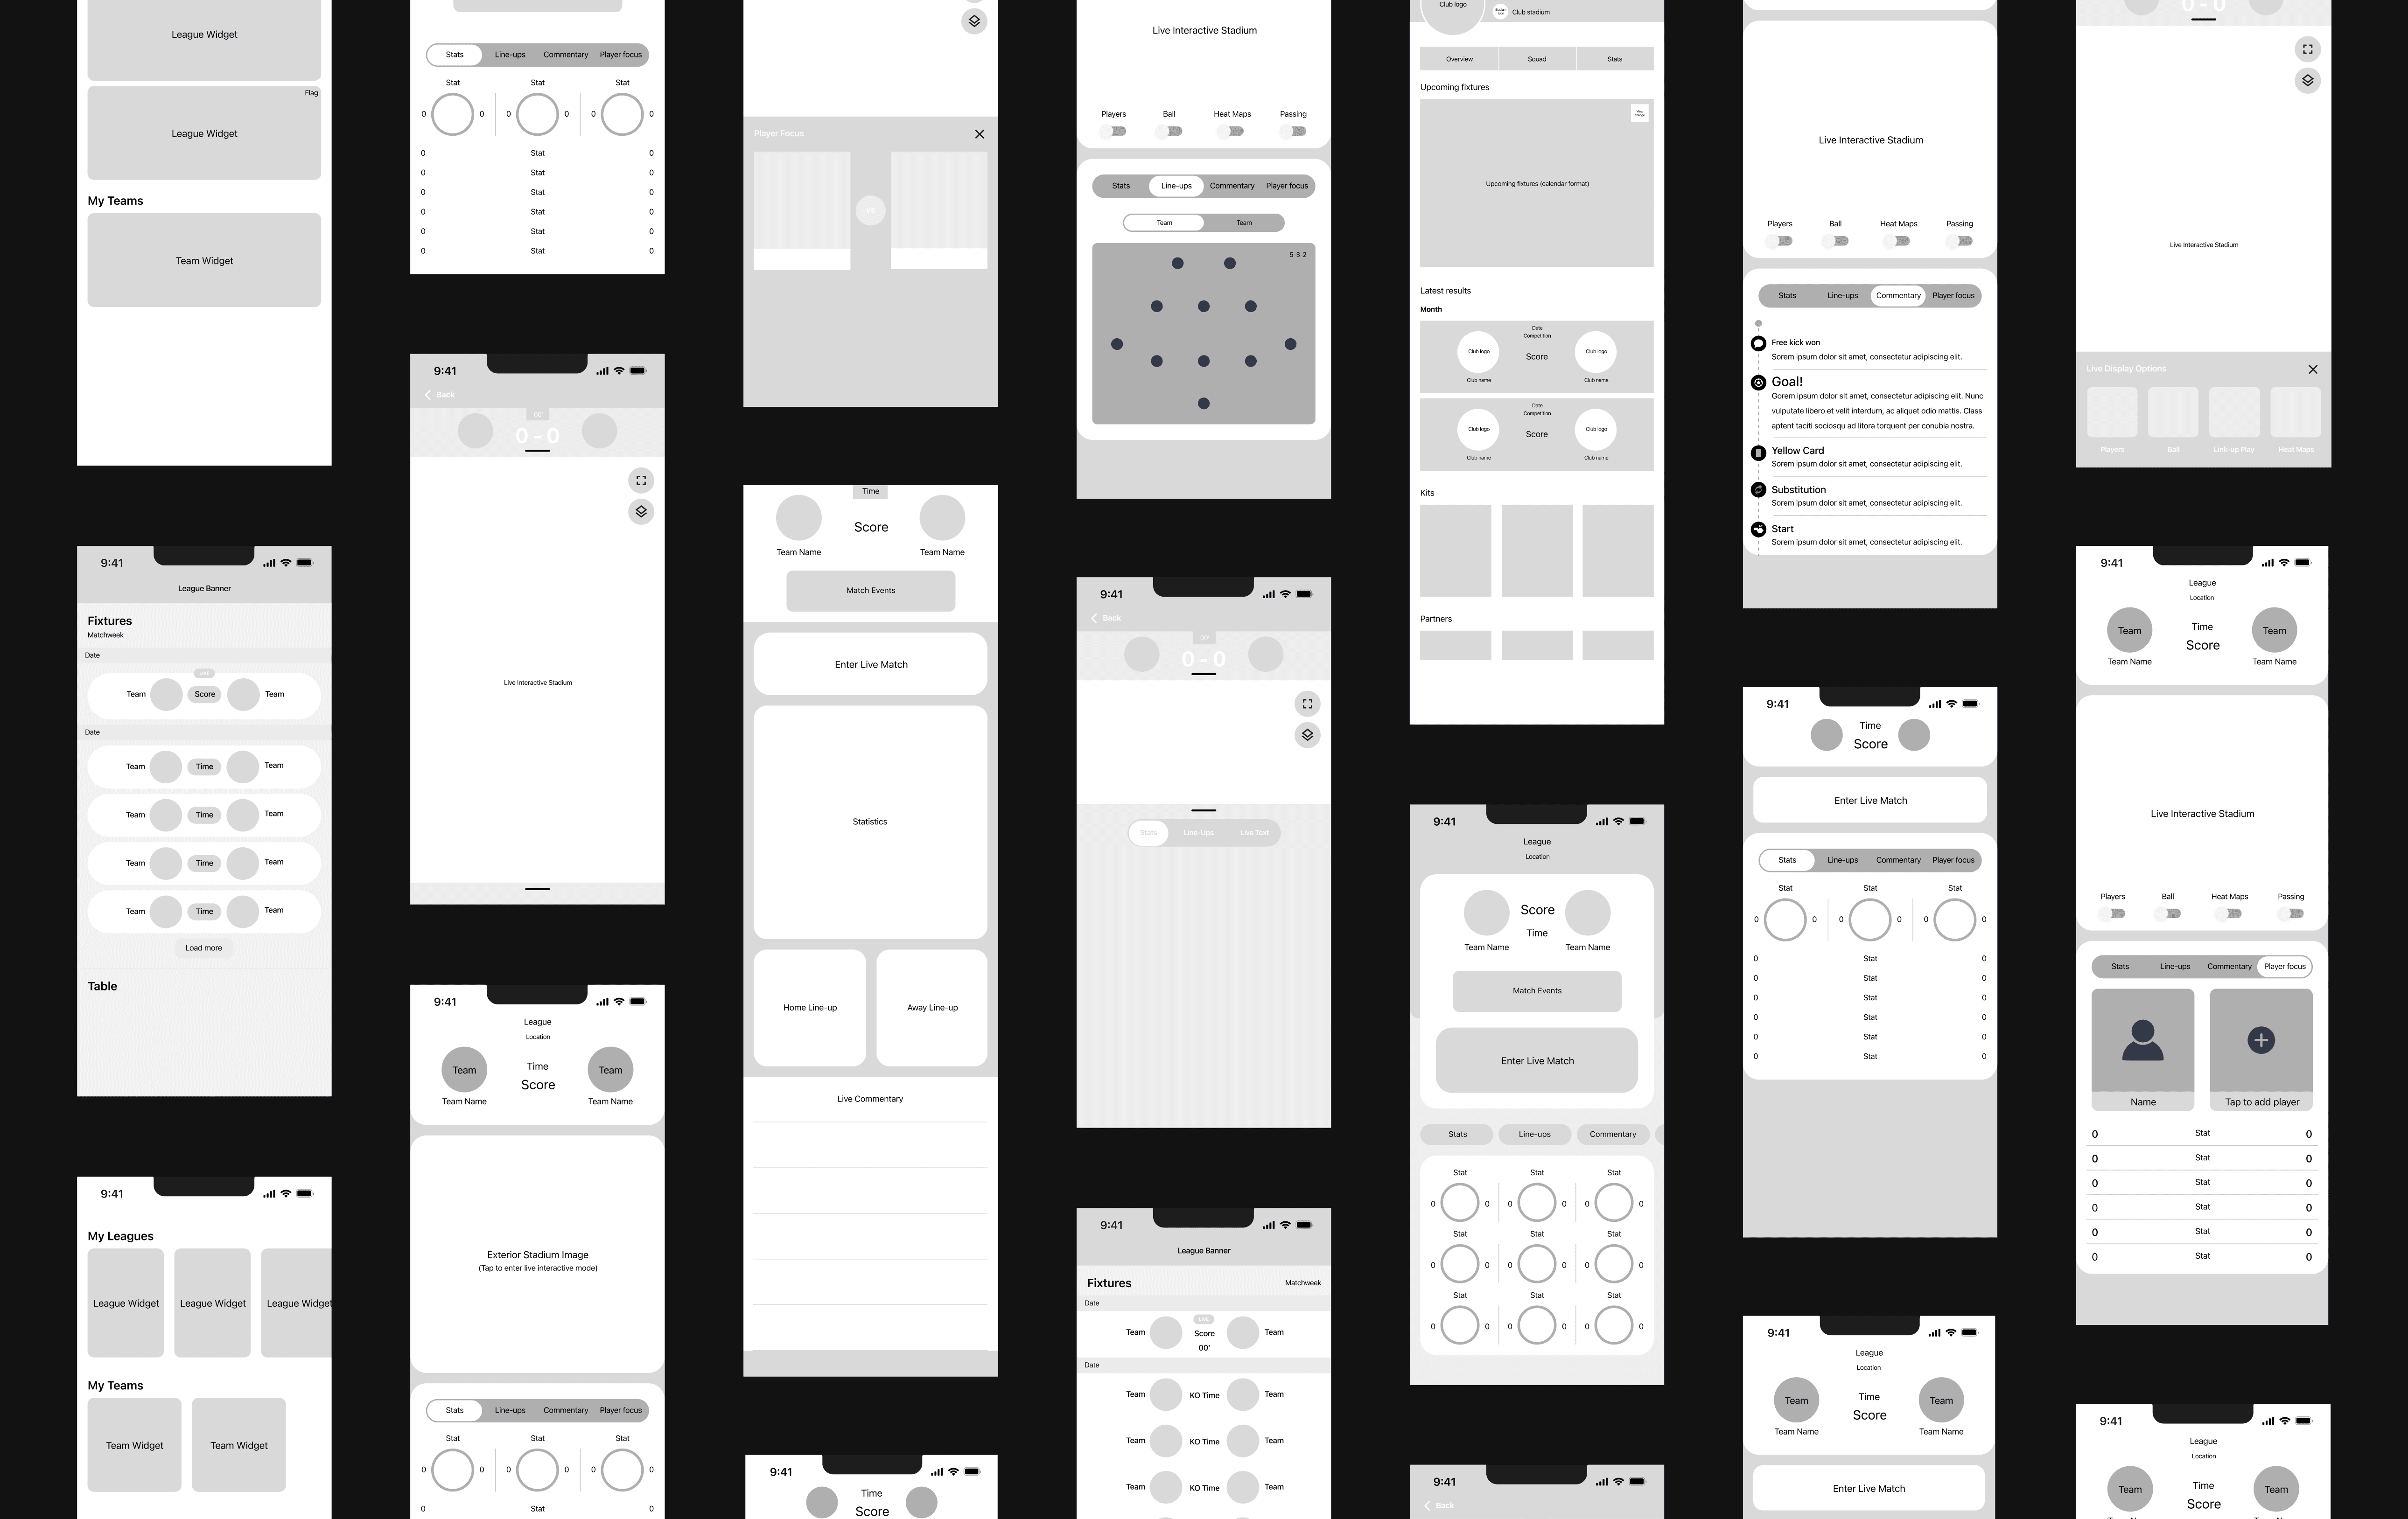
Wireframes

PLAYER COMPARISON FLOW
FINAL EXECUTION
Redefining football consumption.
Home and League Pages
On the initial interface, users can choose to view their preferred competition or team. Once within a competition, the user gains access to matchweek fixtures. Upcoming fixtures display kick-off times; live matches display scores, elapsed time and an option to view live action; and complete fixtures display the final score and a replay function. This interface also allows users to explore past and upcoming fixtures, along with the league table.
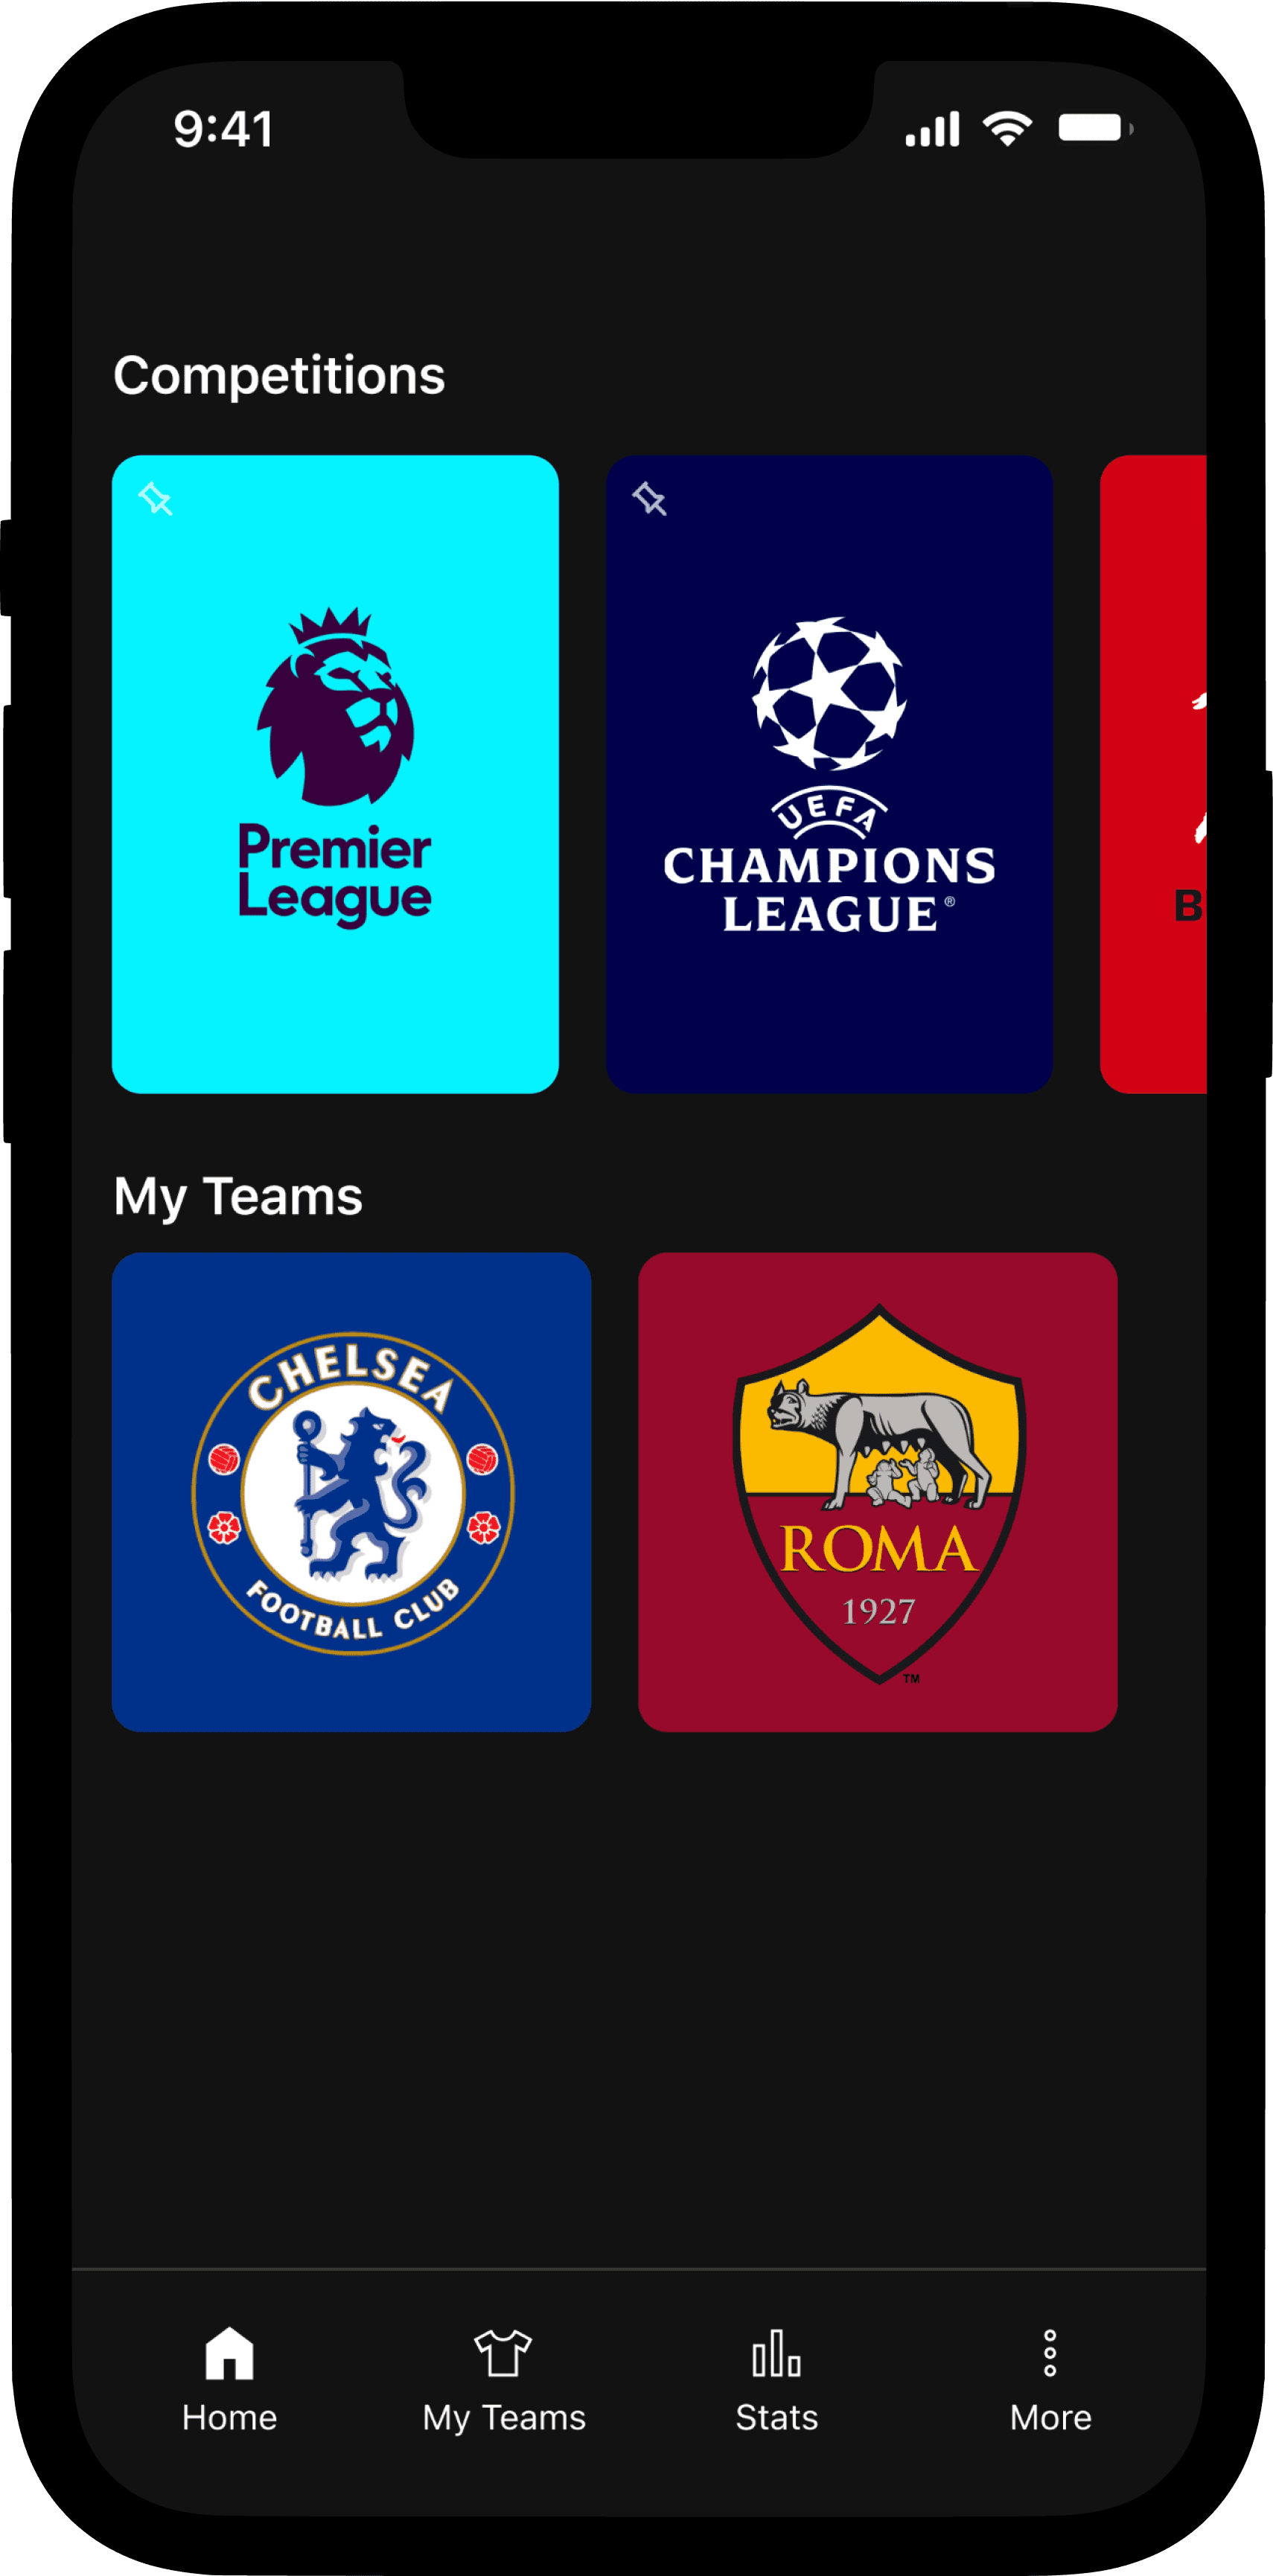
Home Page

Matchweek Fixtures
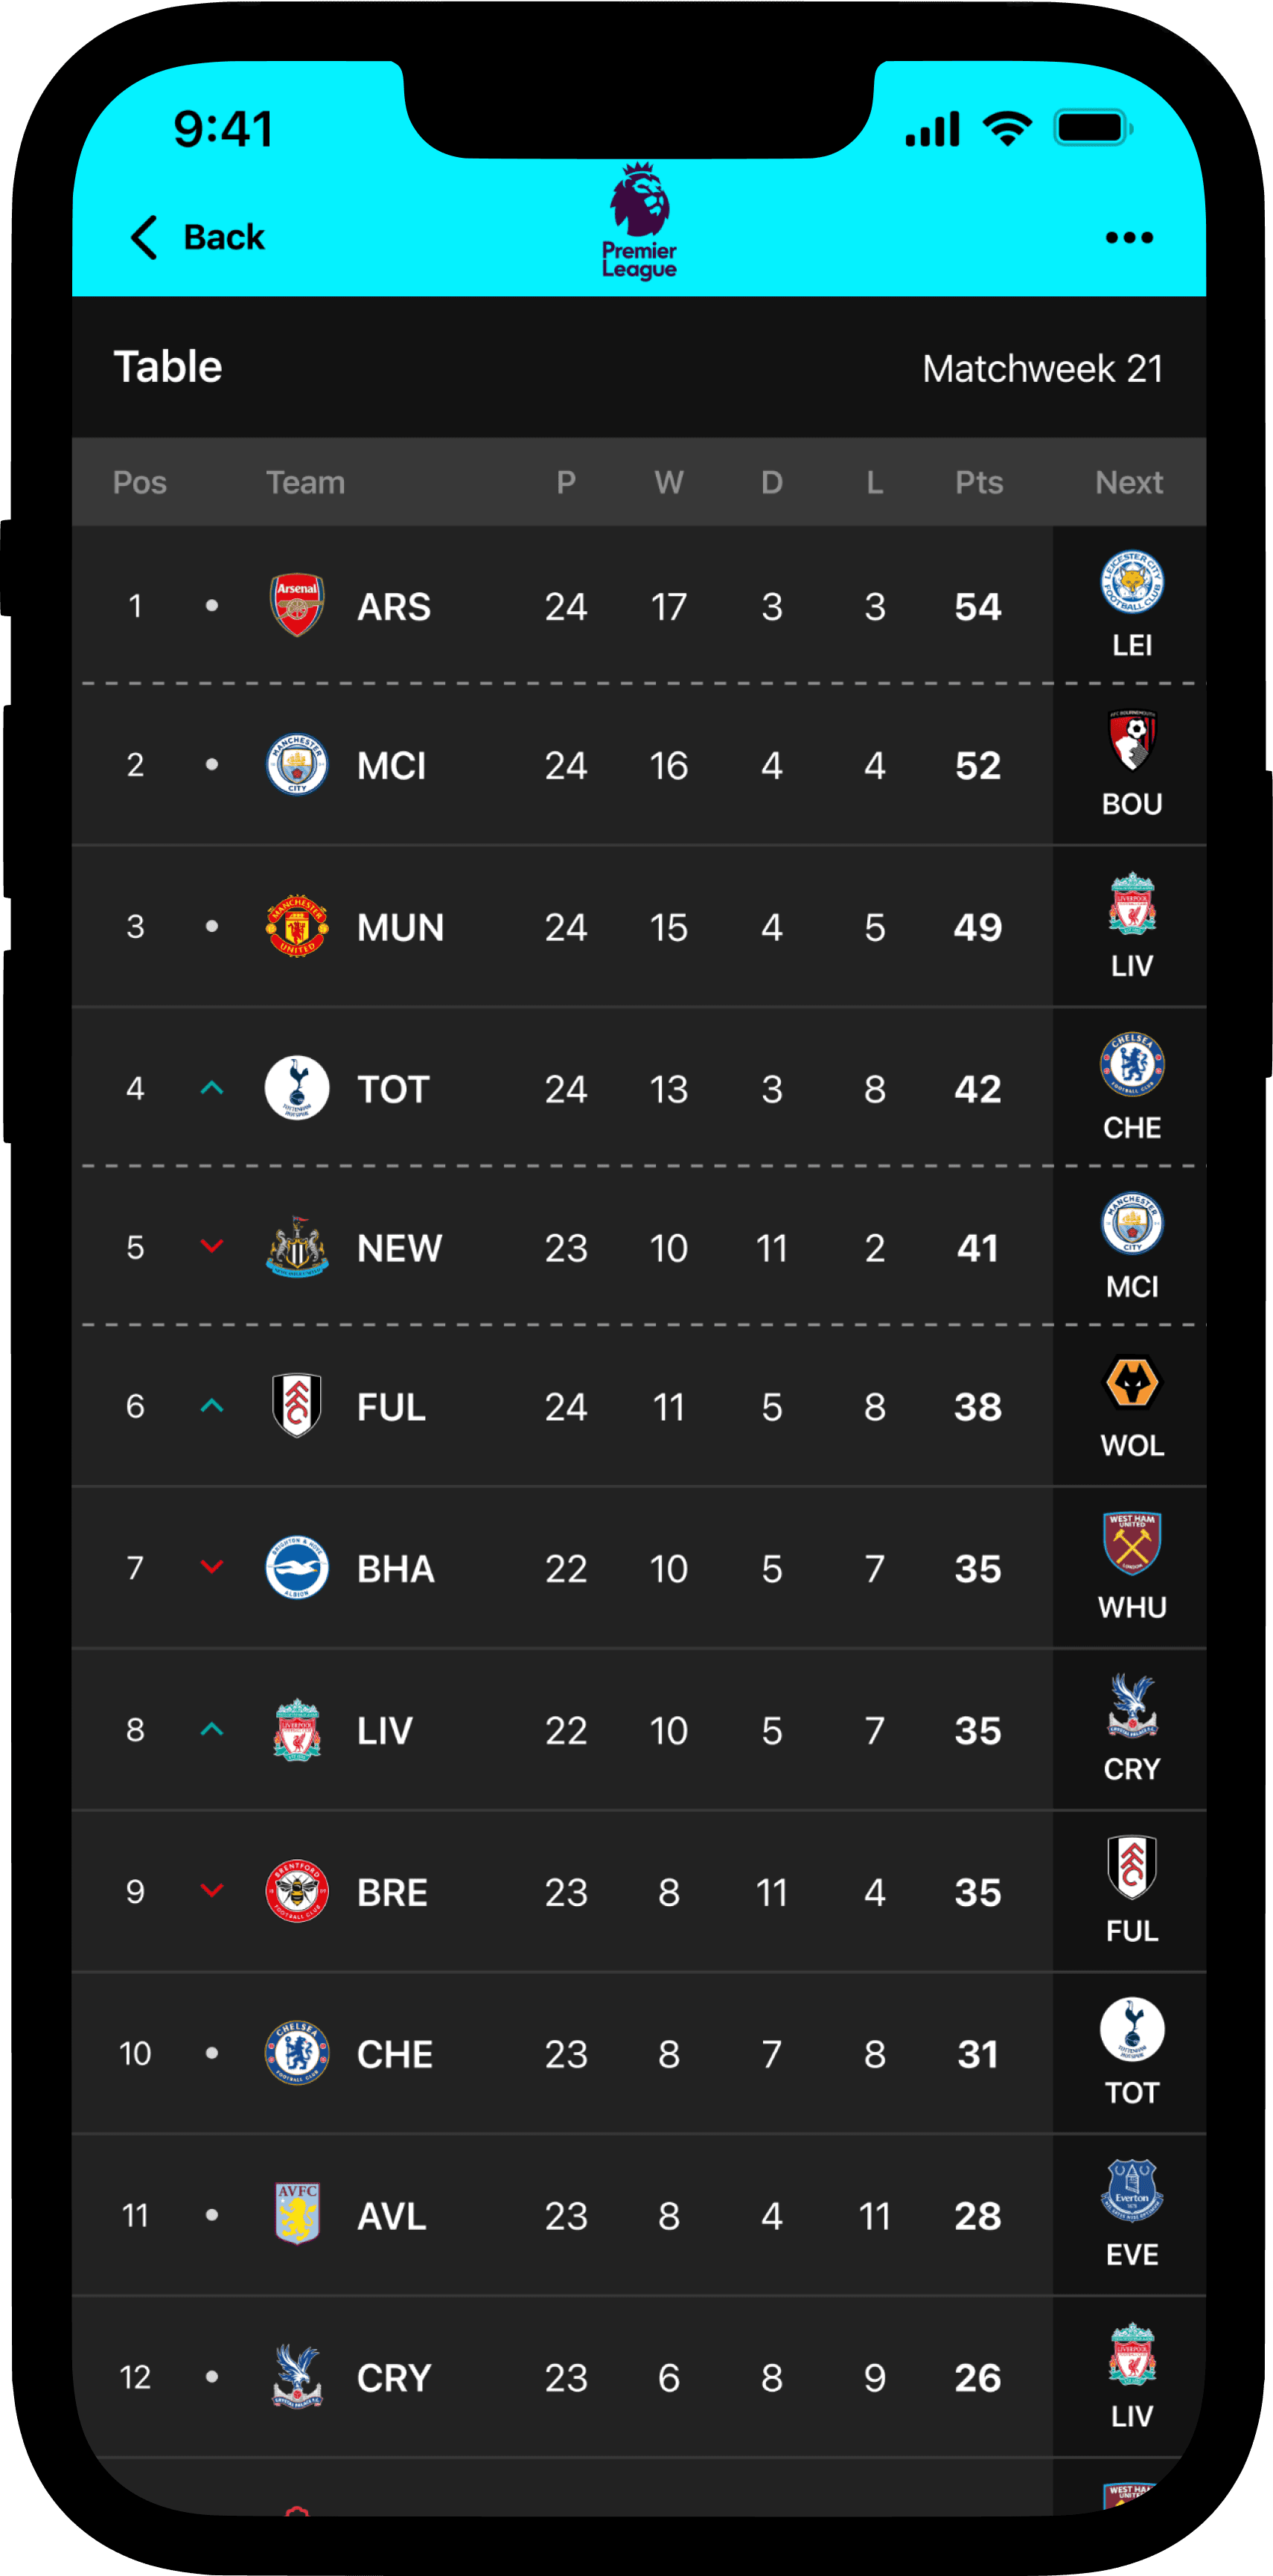
League Table
Live Match
When entering a live match, users encounter an expandable scoreboard that encompasses the game summary and a full-screen 3D interactive display of the fixture.
The interactive display, adapted to the home stadium, ensures an immersive experience. It showcases players' movements on the pitch and offers toggles to tailor the displayed content according to user preferences. This live match mode enables users to focus on specific players, accessing detailed live stats such as expected goals, work rate and pass completion. Users can also make player comparisons. General game stats, line-ups and live text are accessible via a collapsible overlay, providing valuable information for the target audience.

Live Match Landing
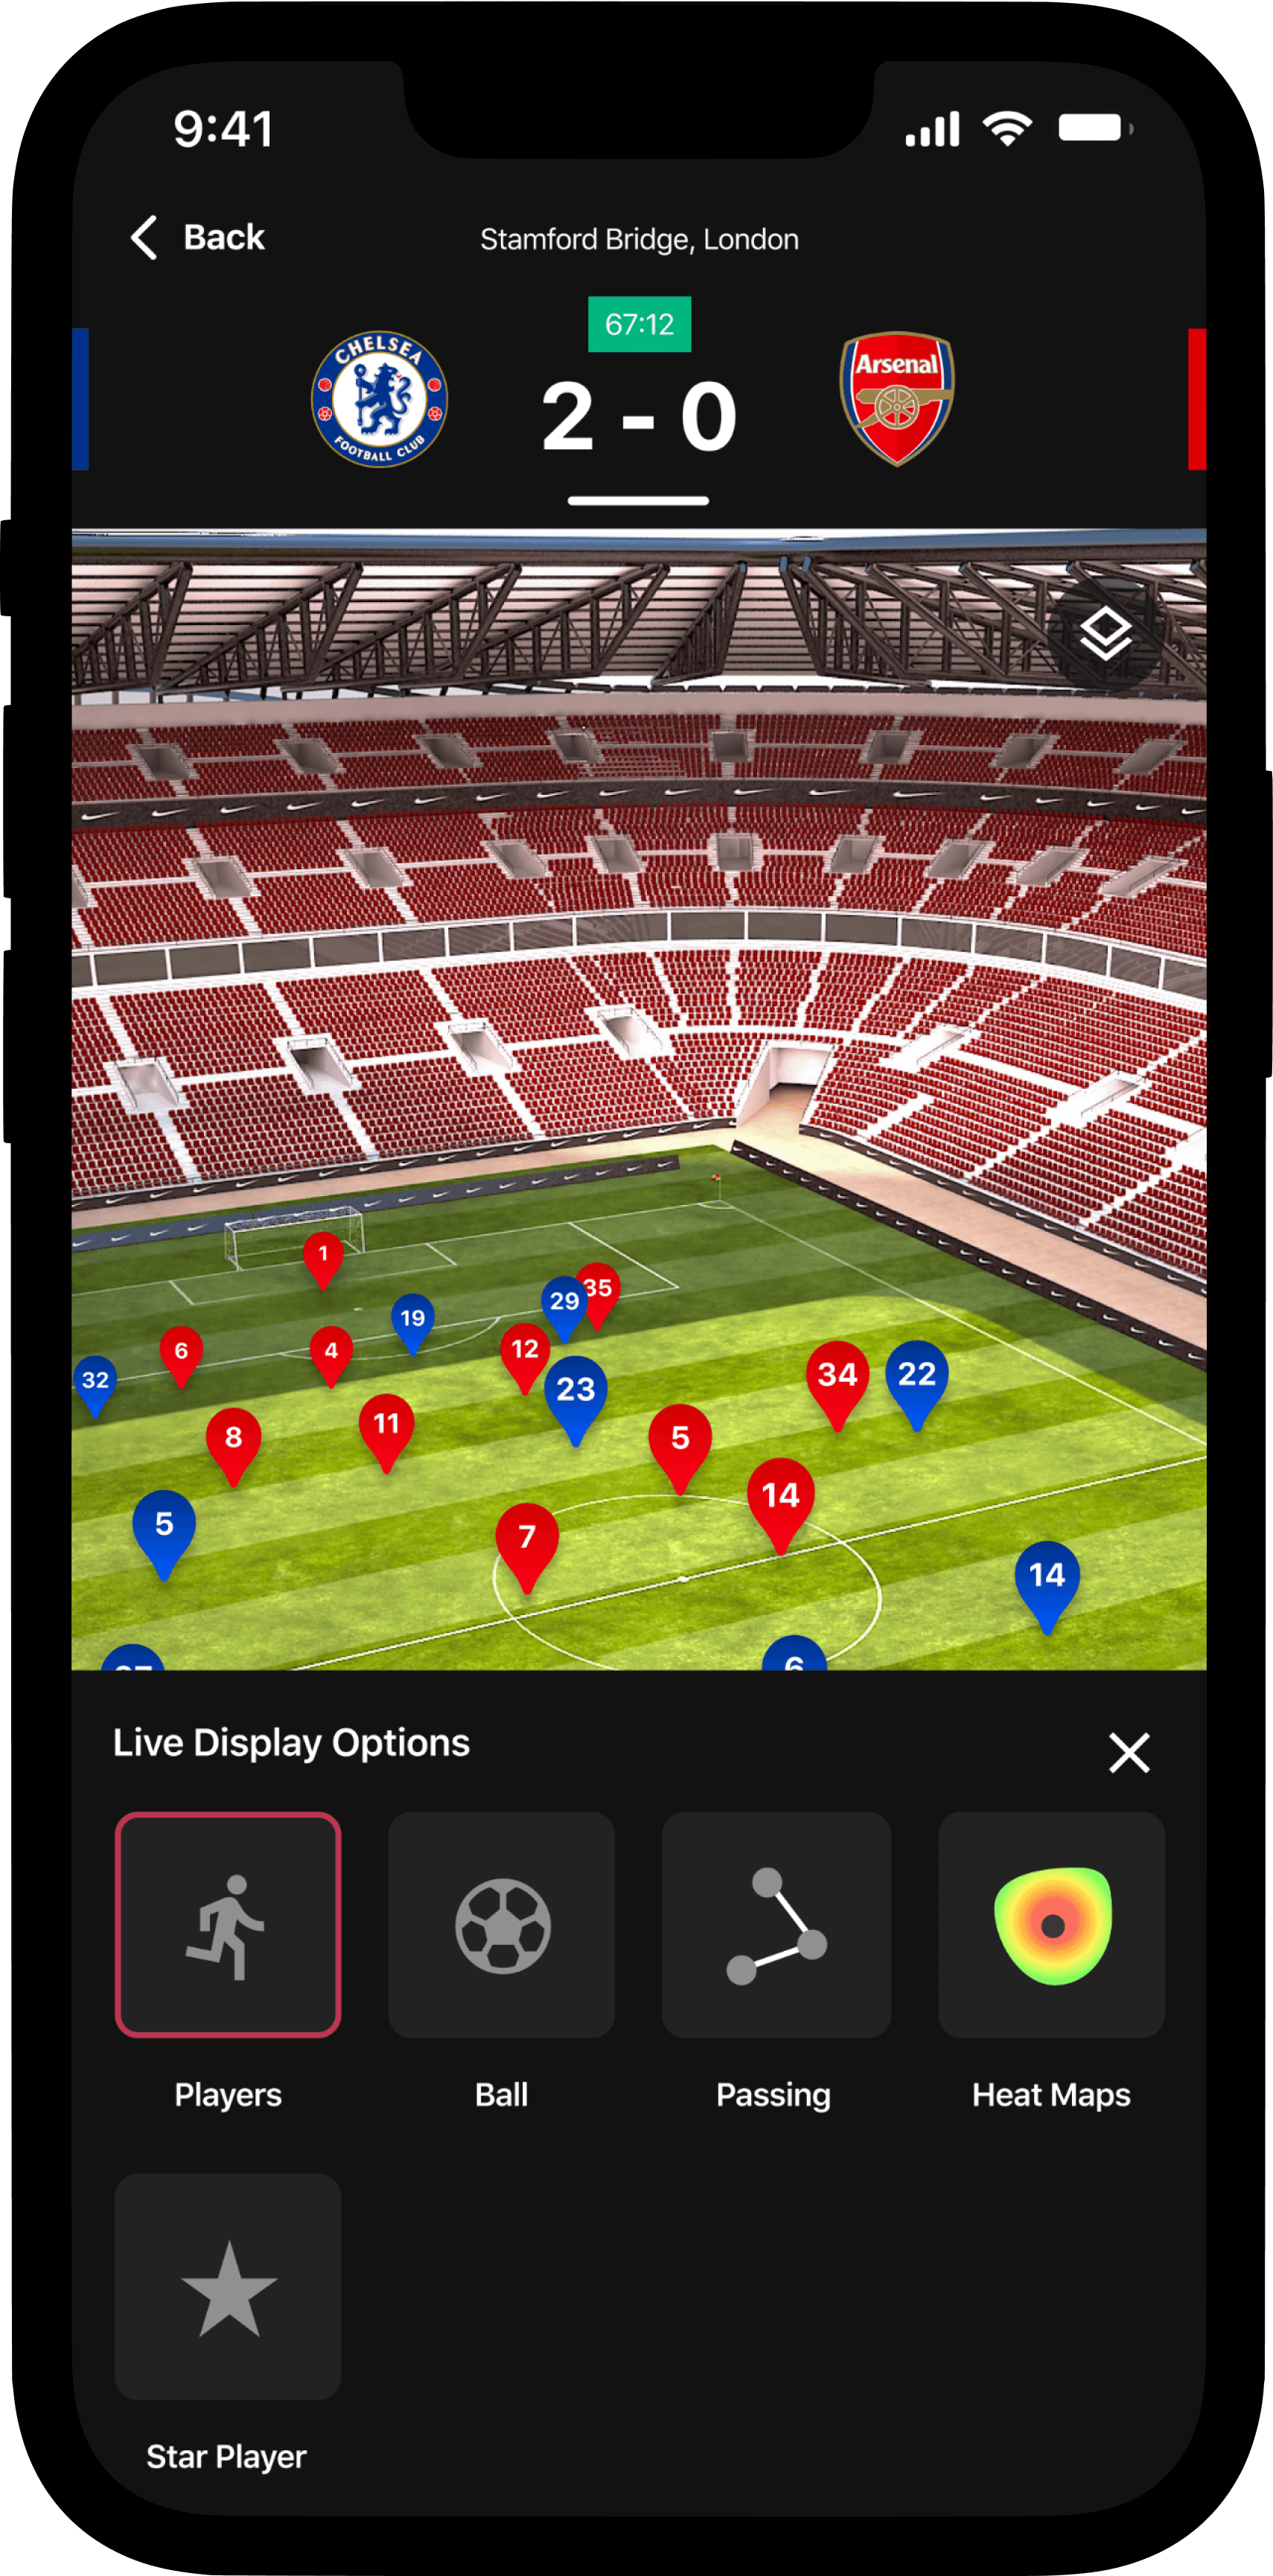
View Preferences
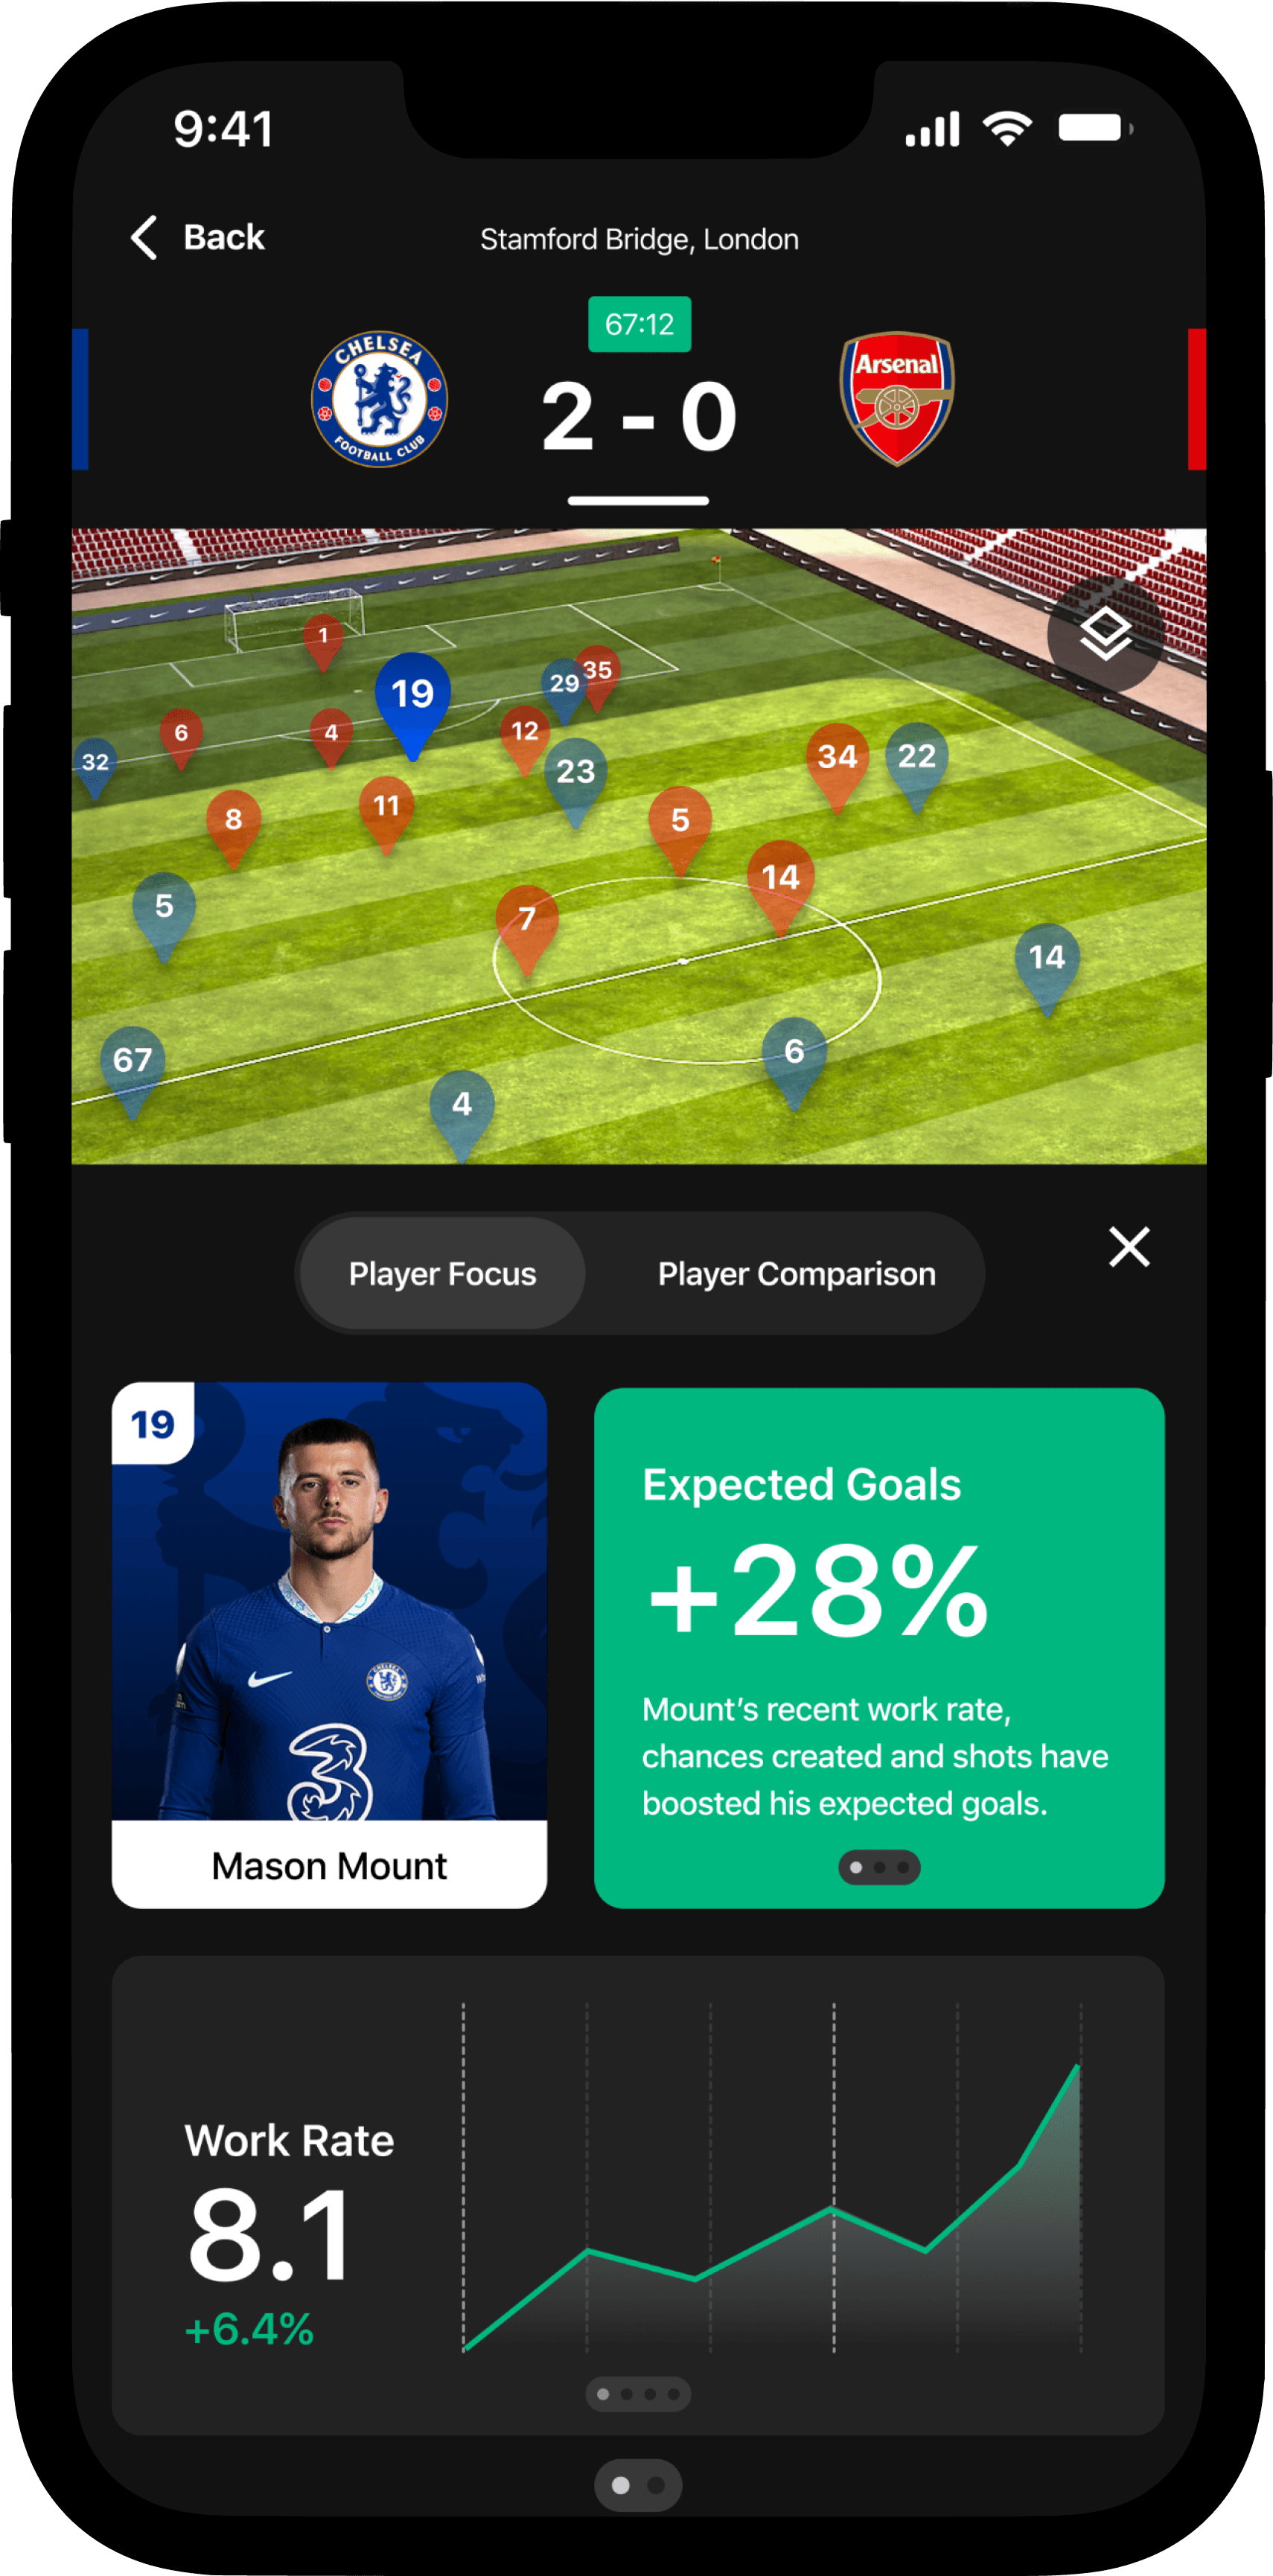
Player Focus

More Player Focus

Player Comparison

Match Statistics
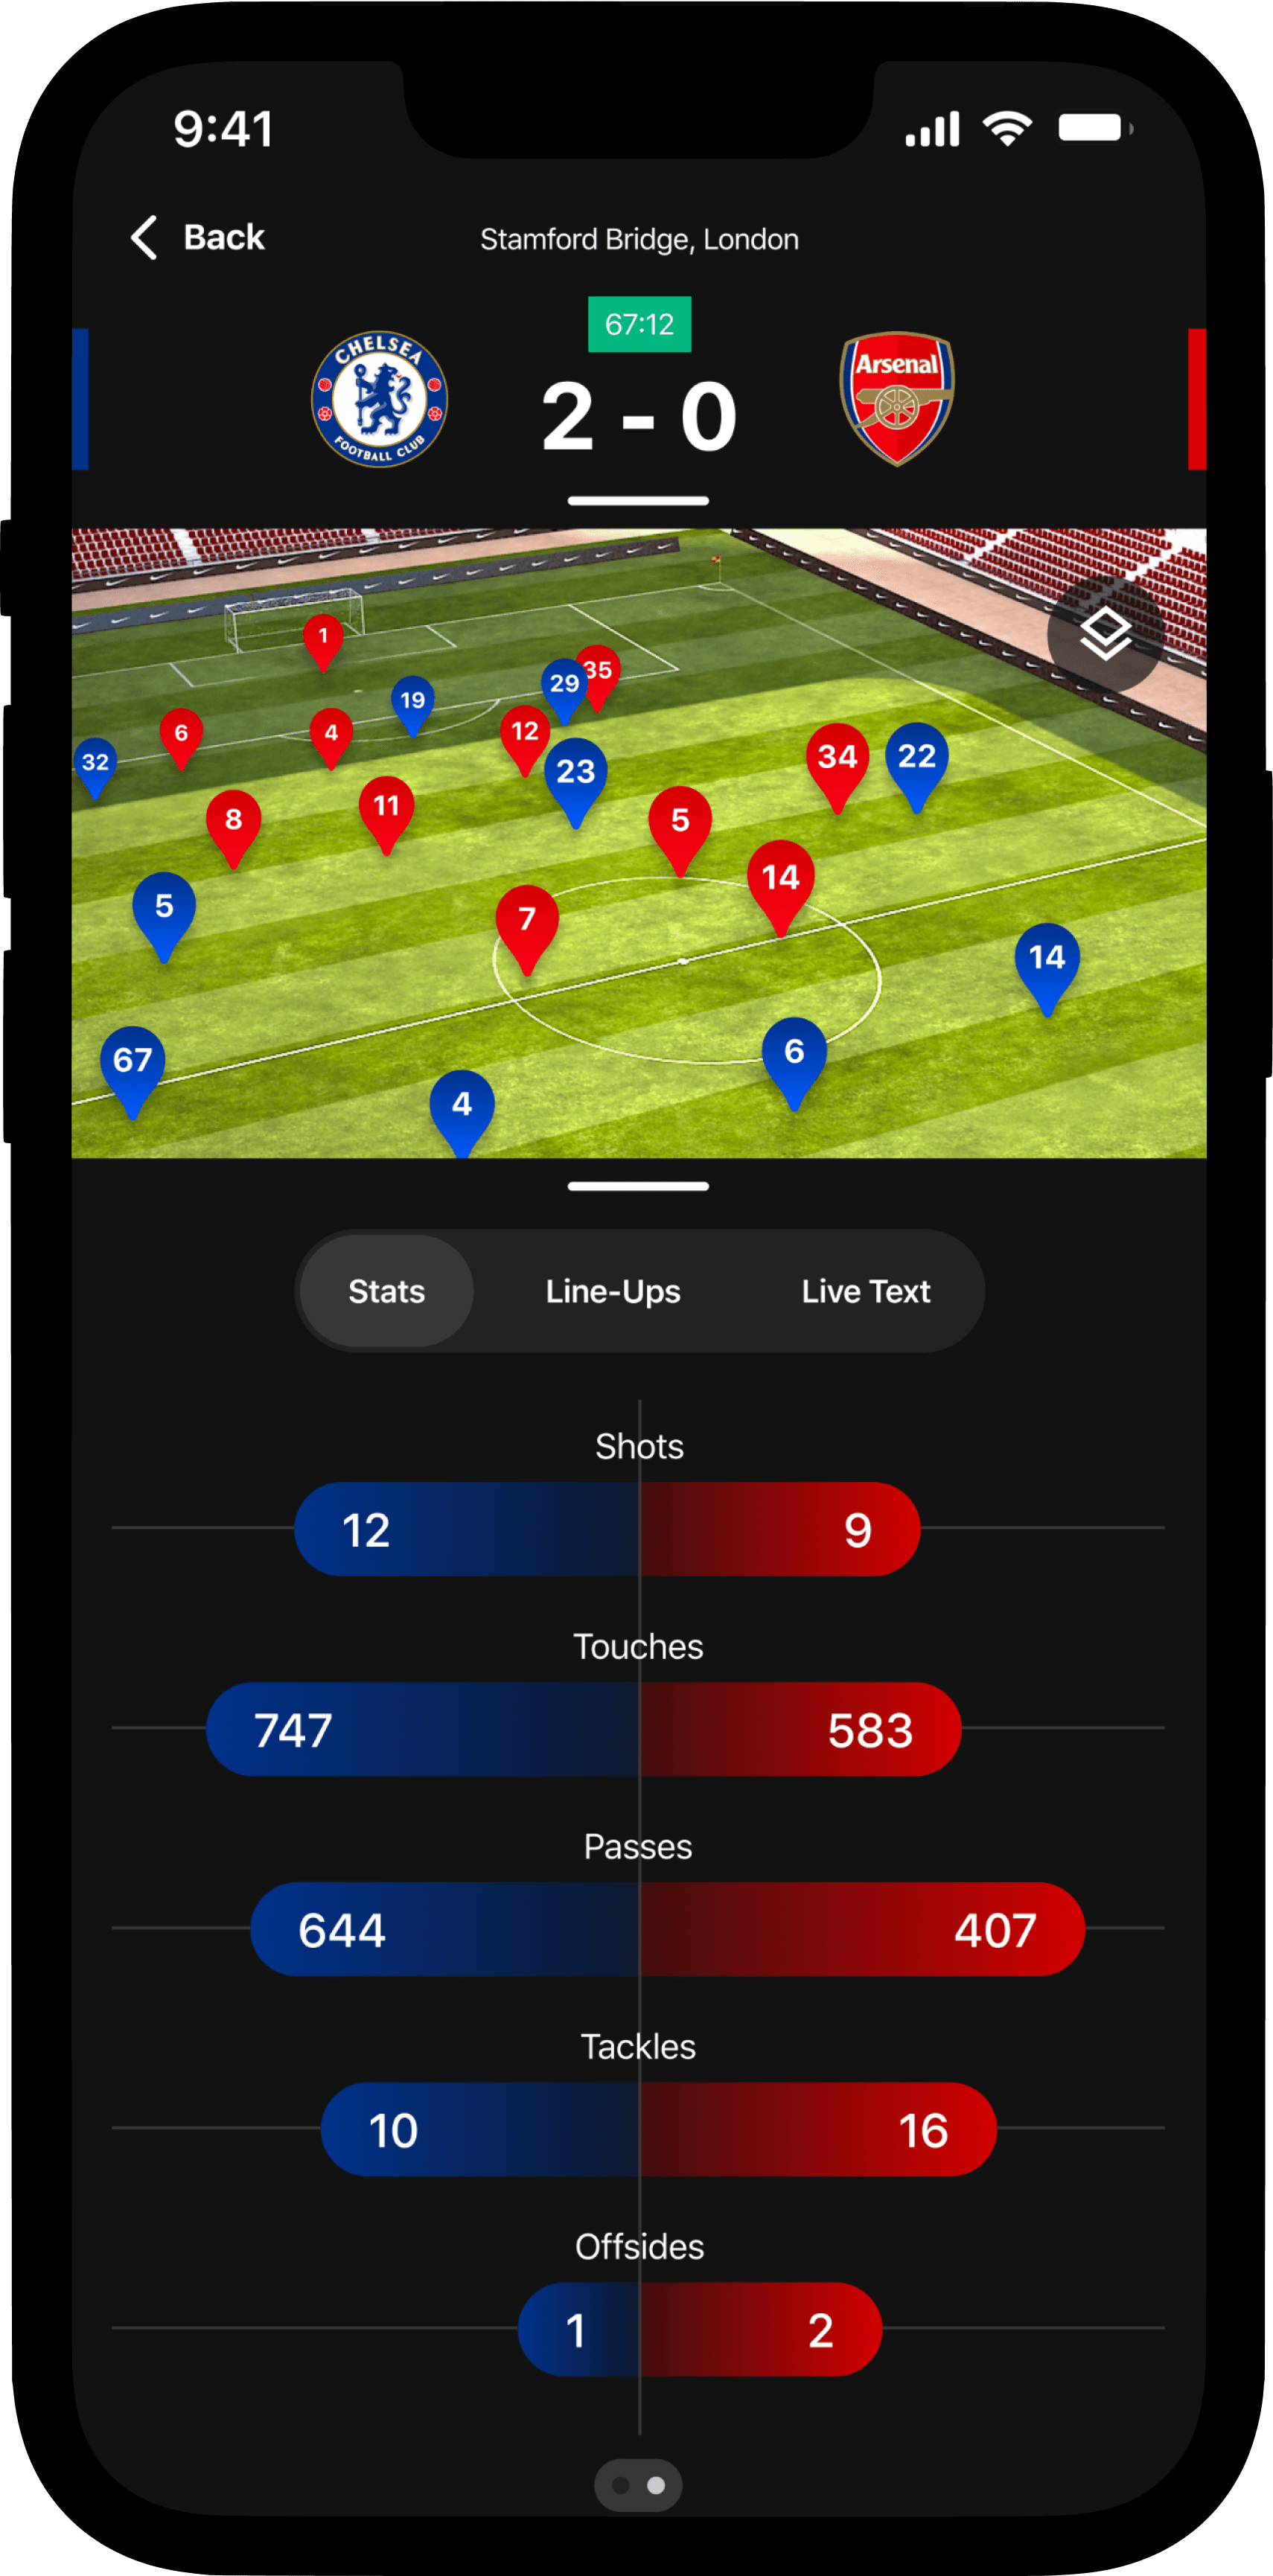
More Match Statistics
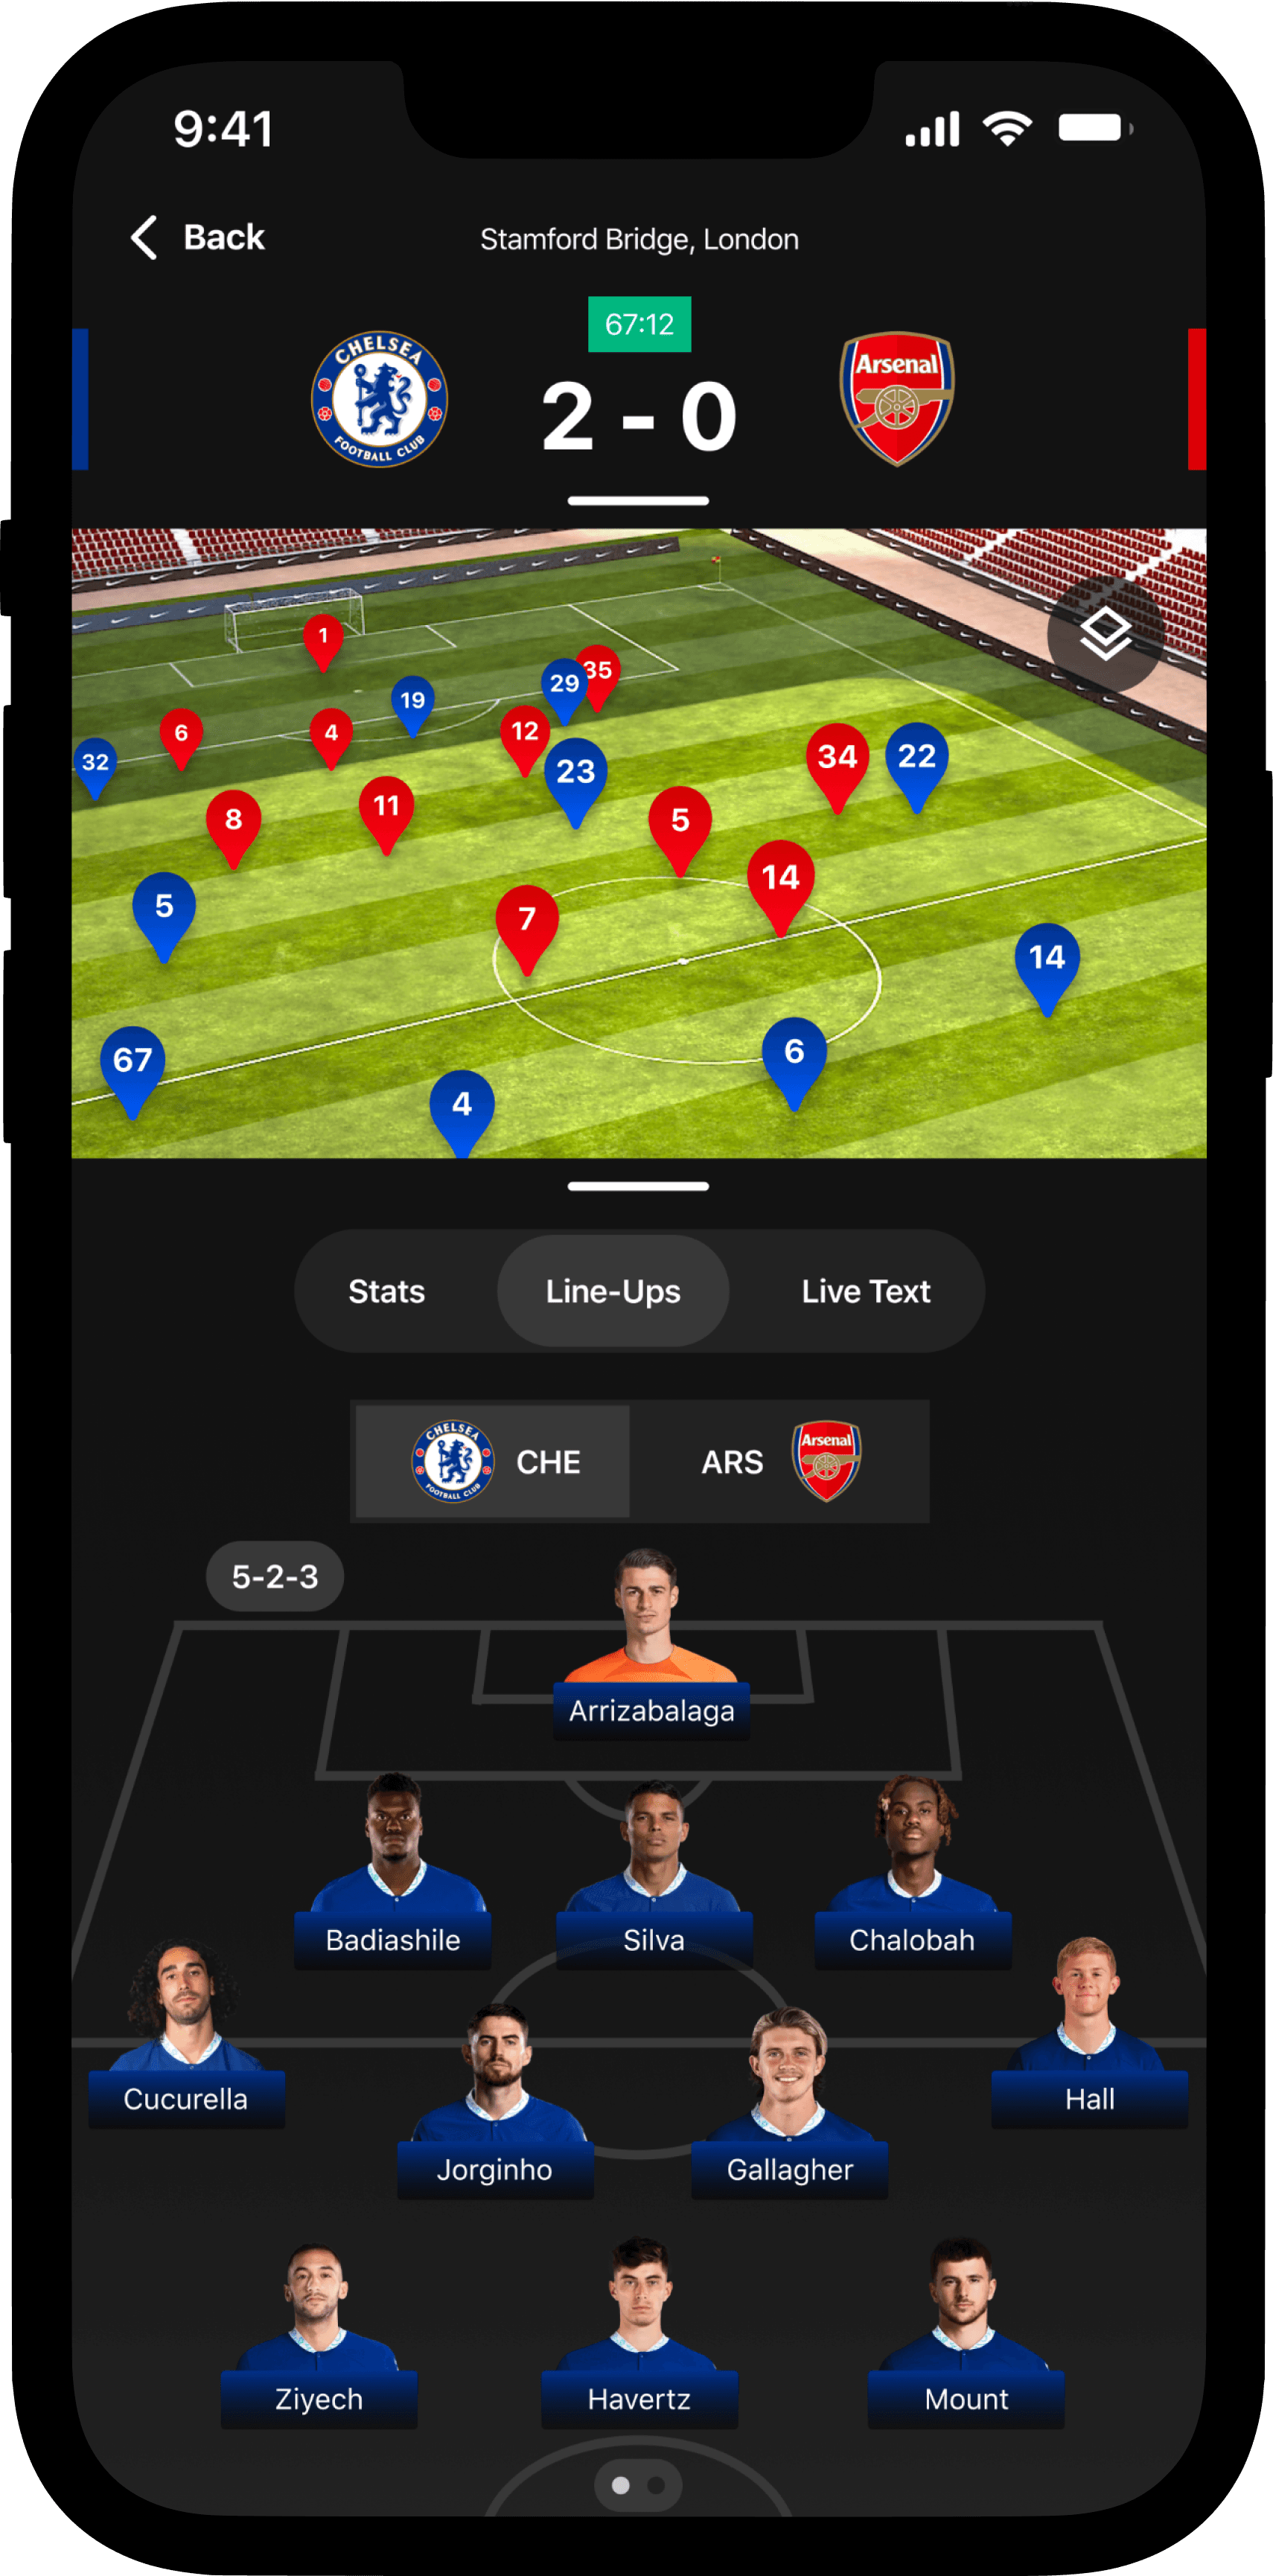
Line-ups

Live Text
Live Match in Pro Mode
In addition to the standard portrait live match screen, users have access to the landscape alternative known as "Live Match Pro." This mode offers a more comprehensive view of on-pitch statistics via overlays. Users can access detailed data like possession, line breaks, final third entries and other advanced statistics for a more in-depth analysis.

Live Match Pro Standard View

Possession
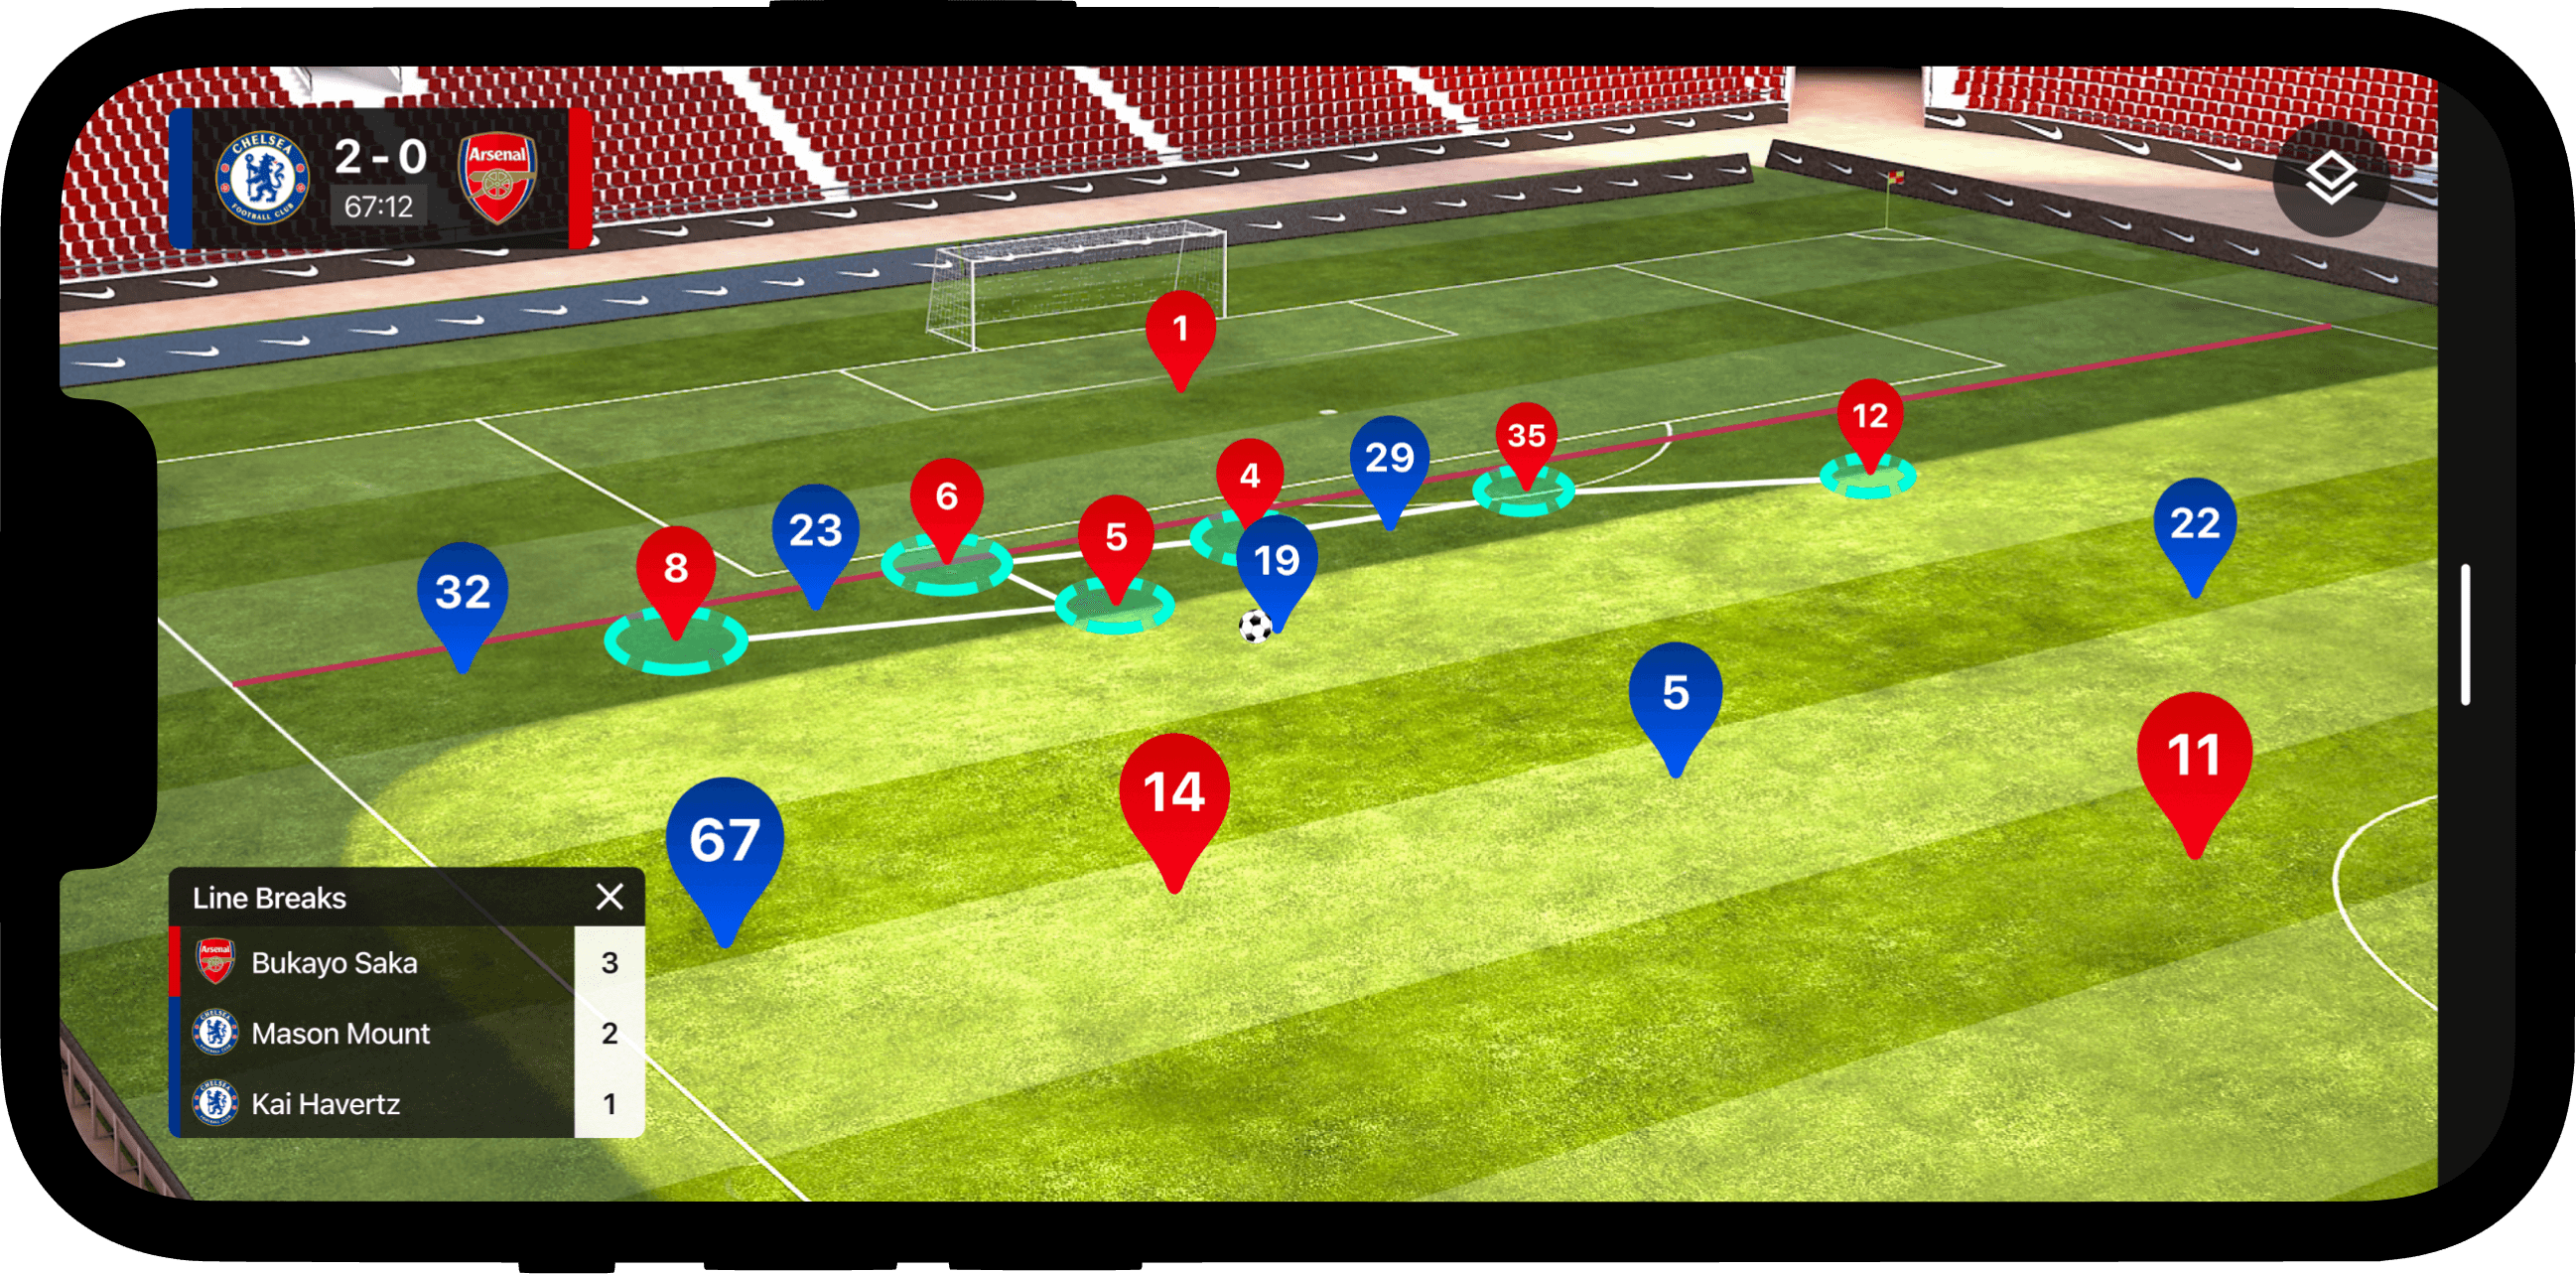
Line Breaks
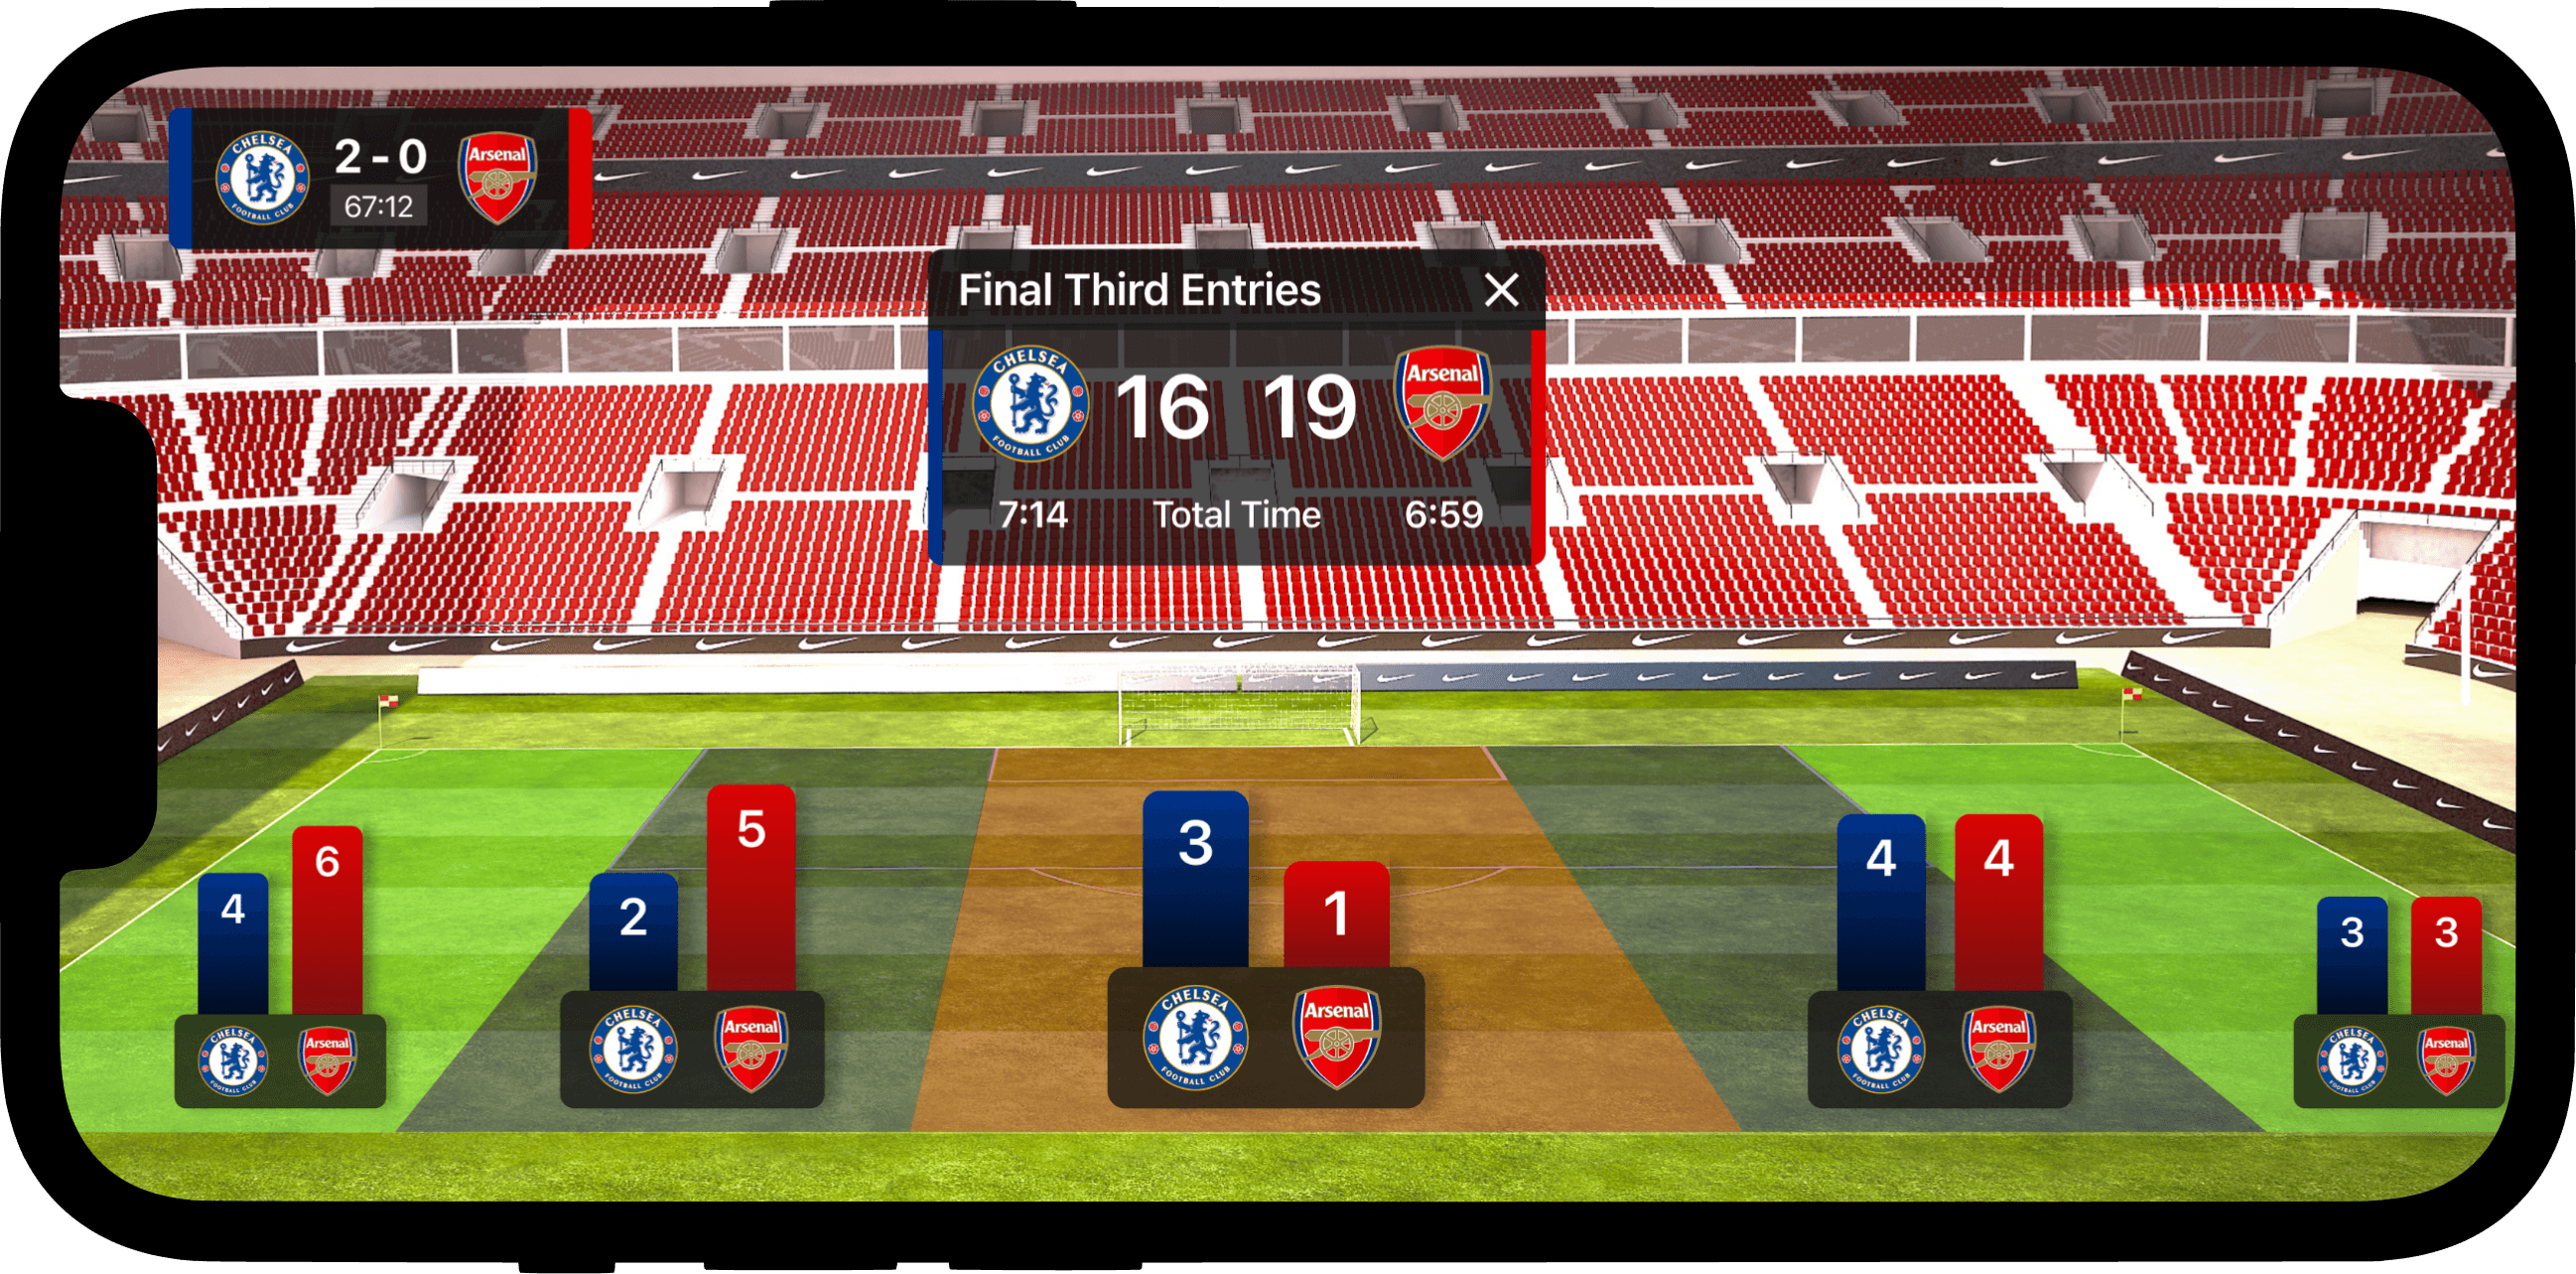
Final Third Entries

Build-up Play
Club Pages
Users can access comprehensive club-specific information via the club pages. This includes a wealth of data regarding upcoming fixtures, recent results, squads and various statistics.
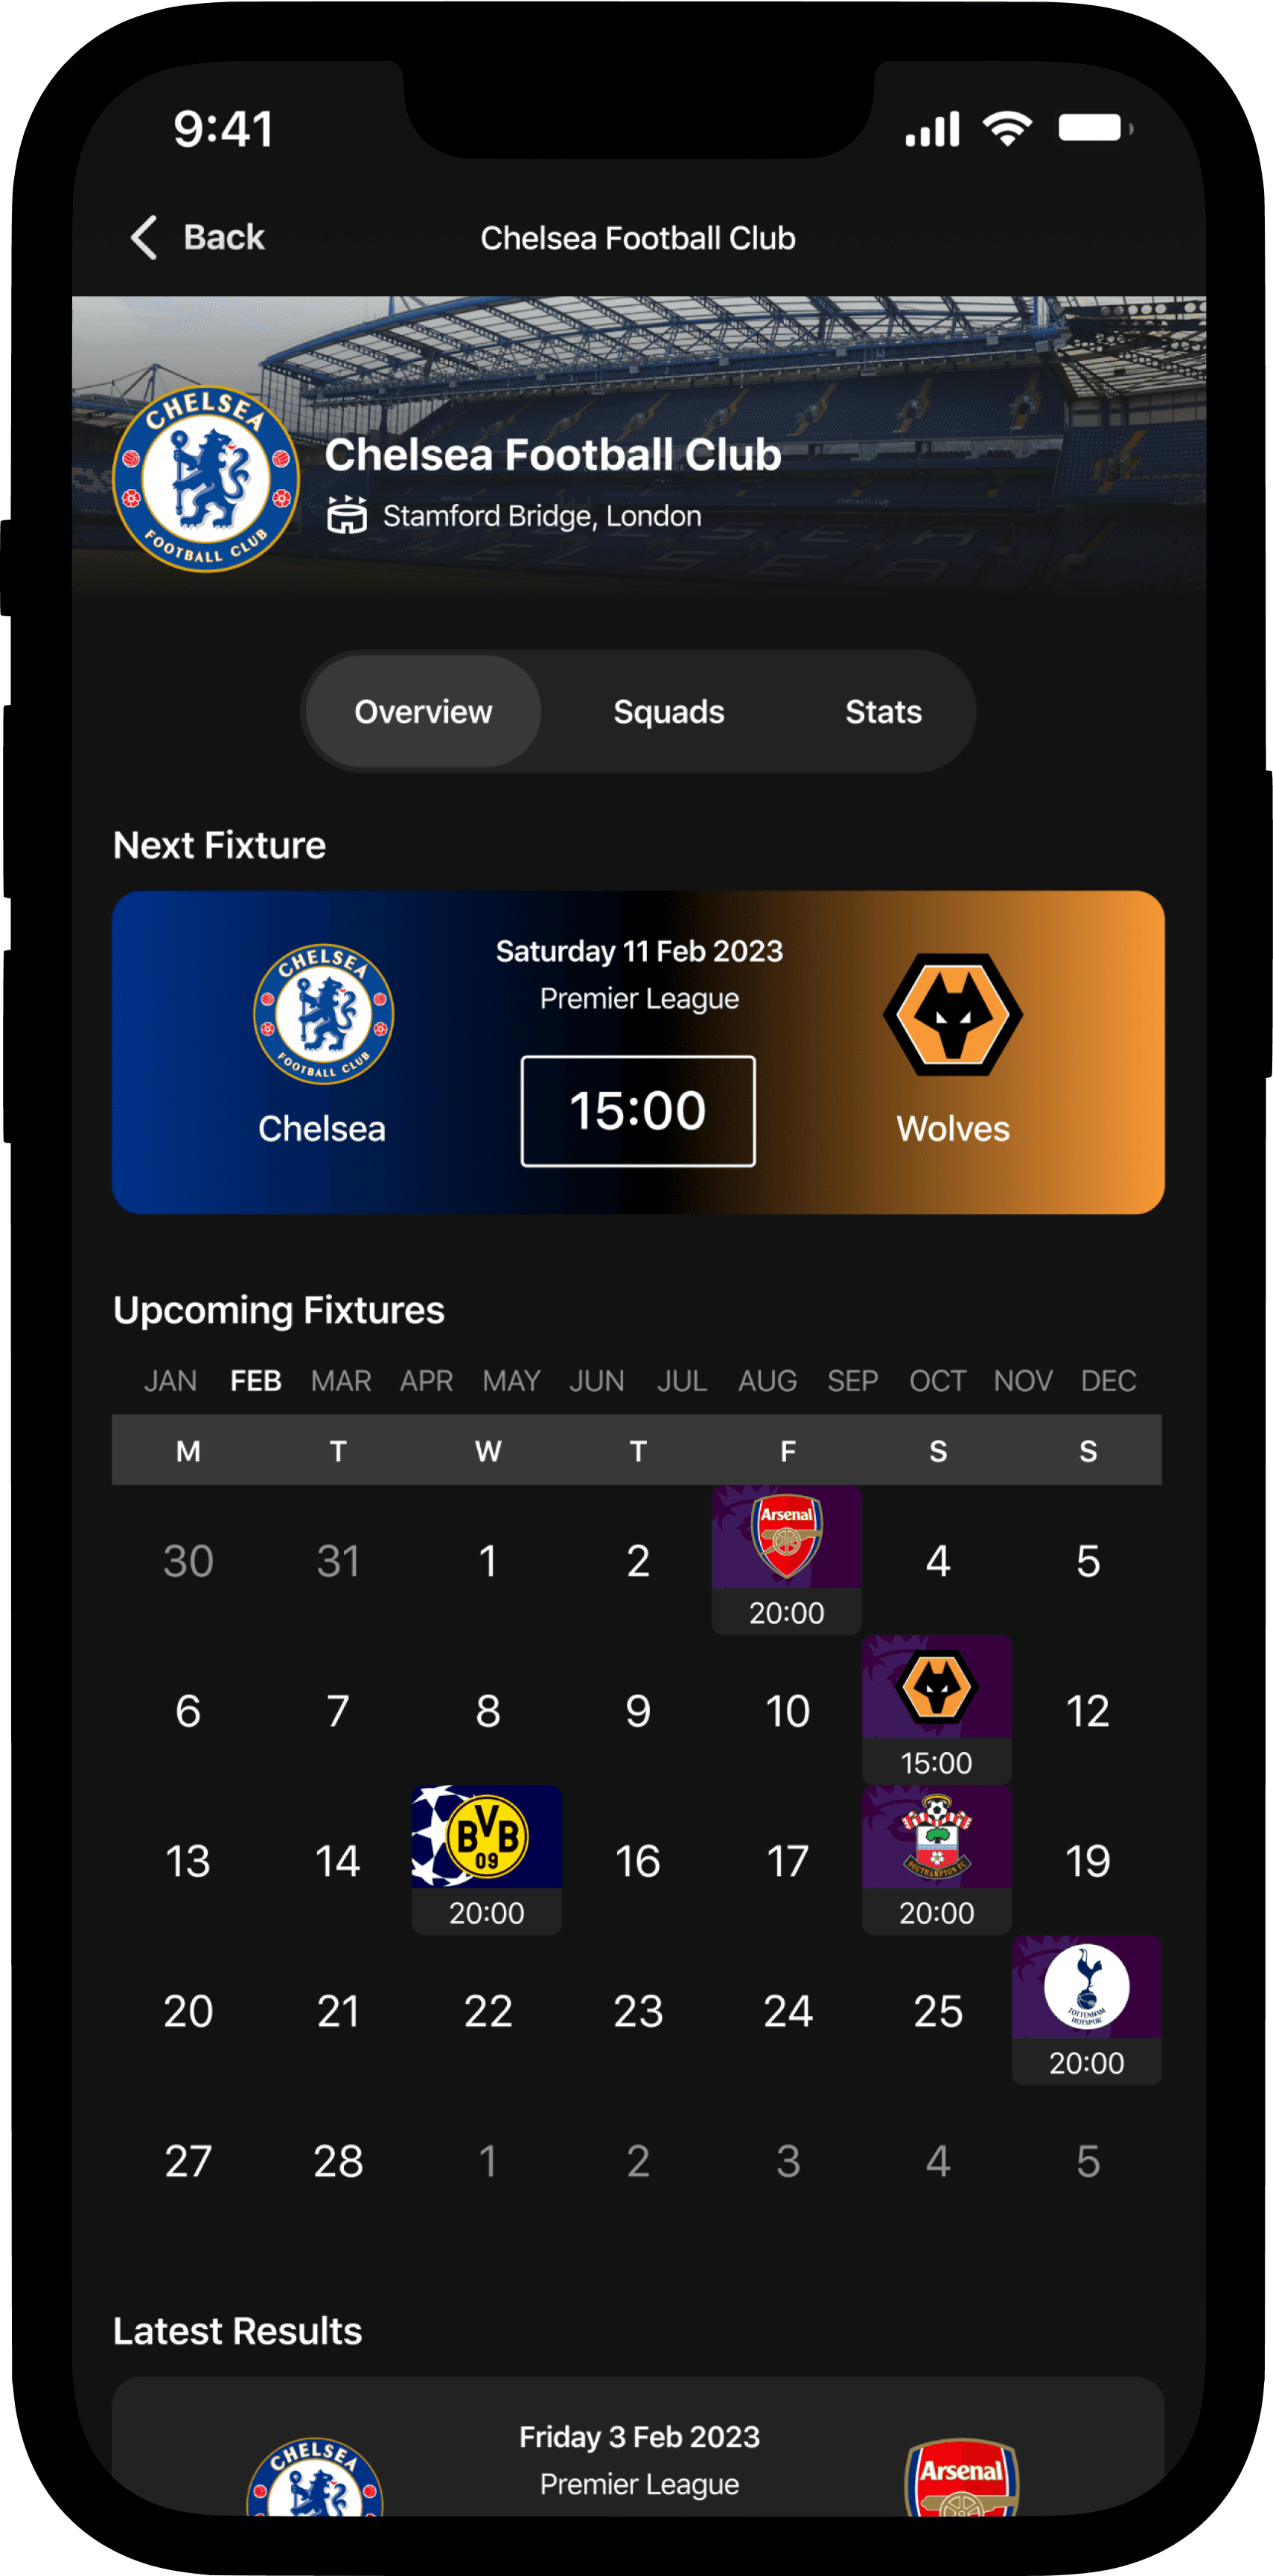
Club Page Overview

Club Squads
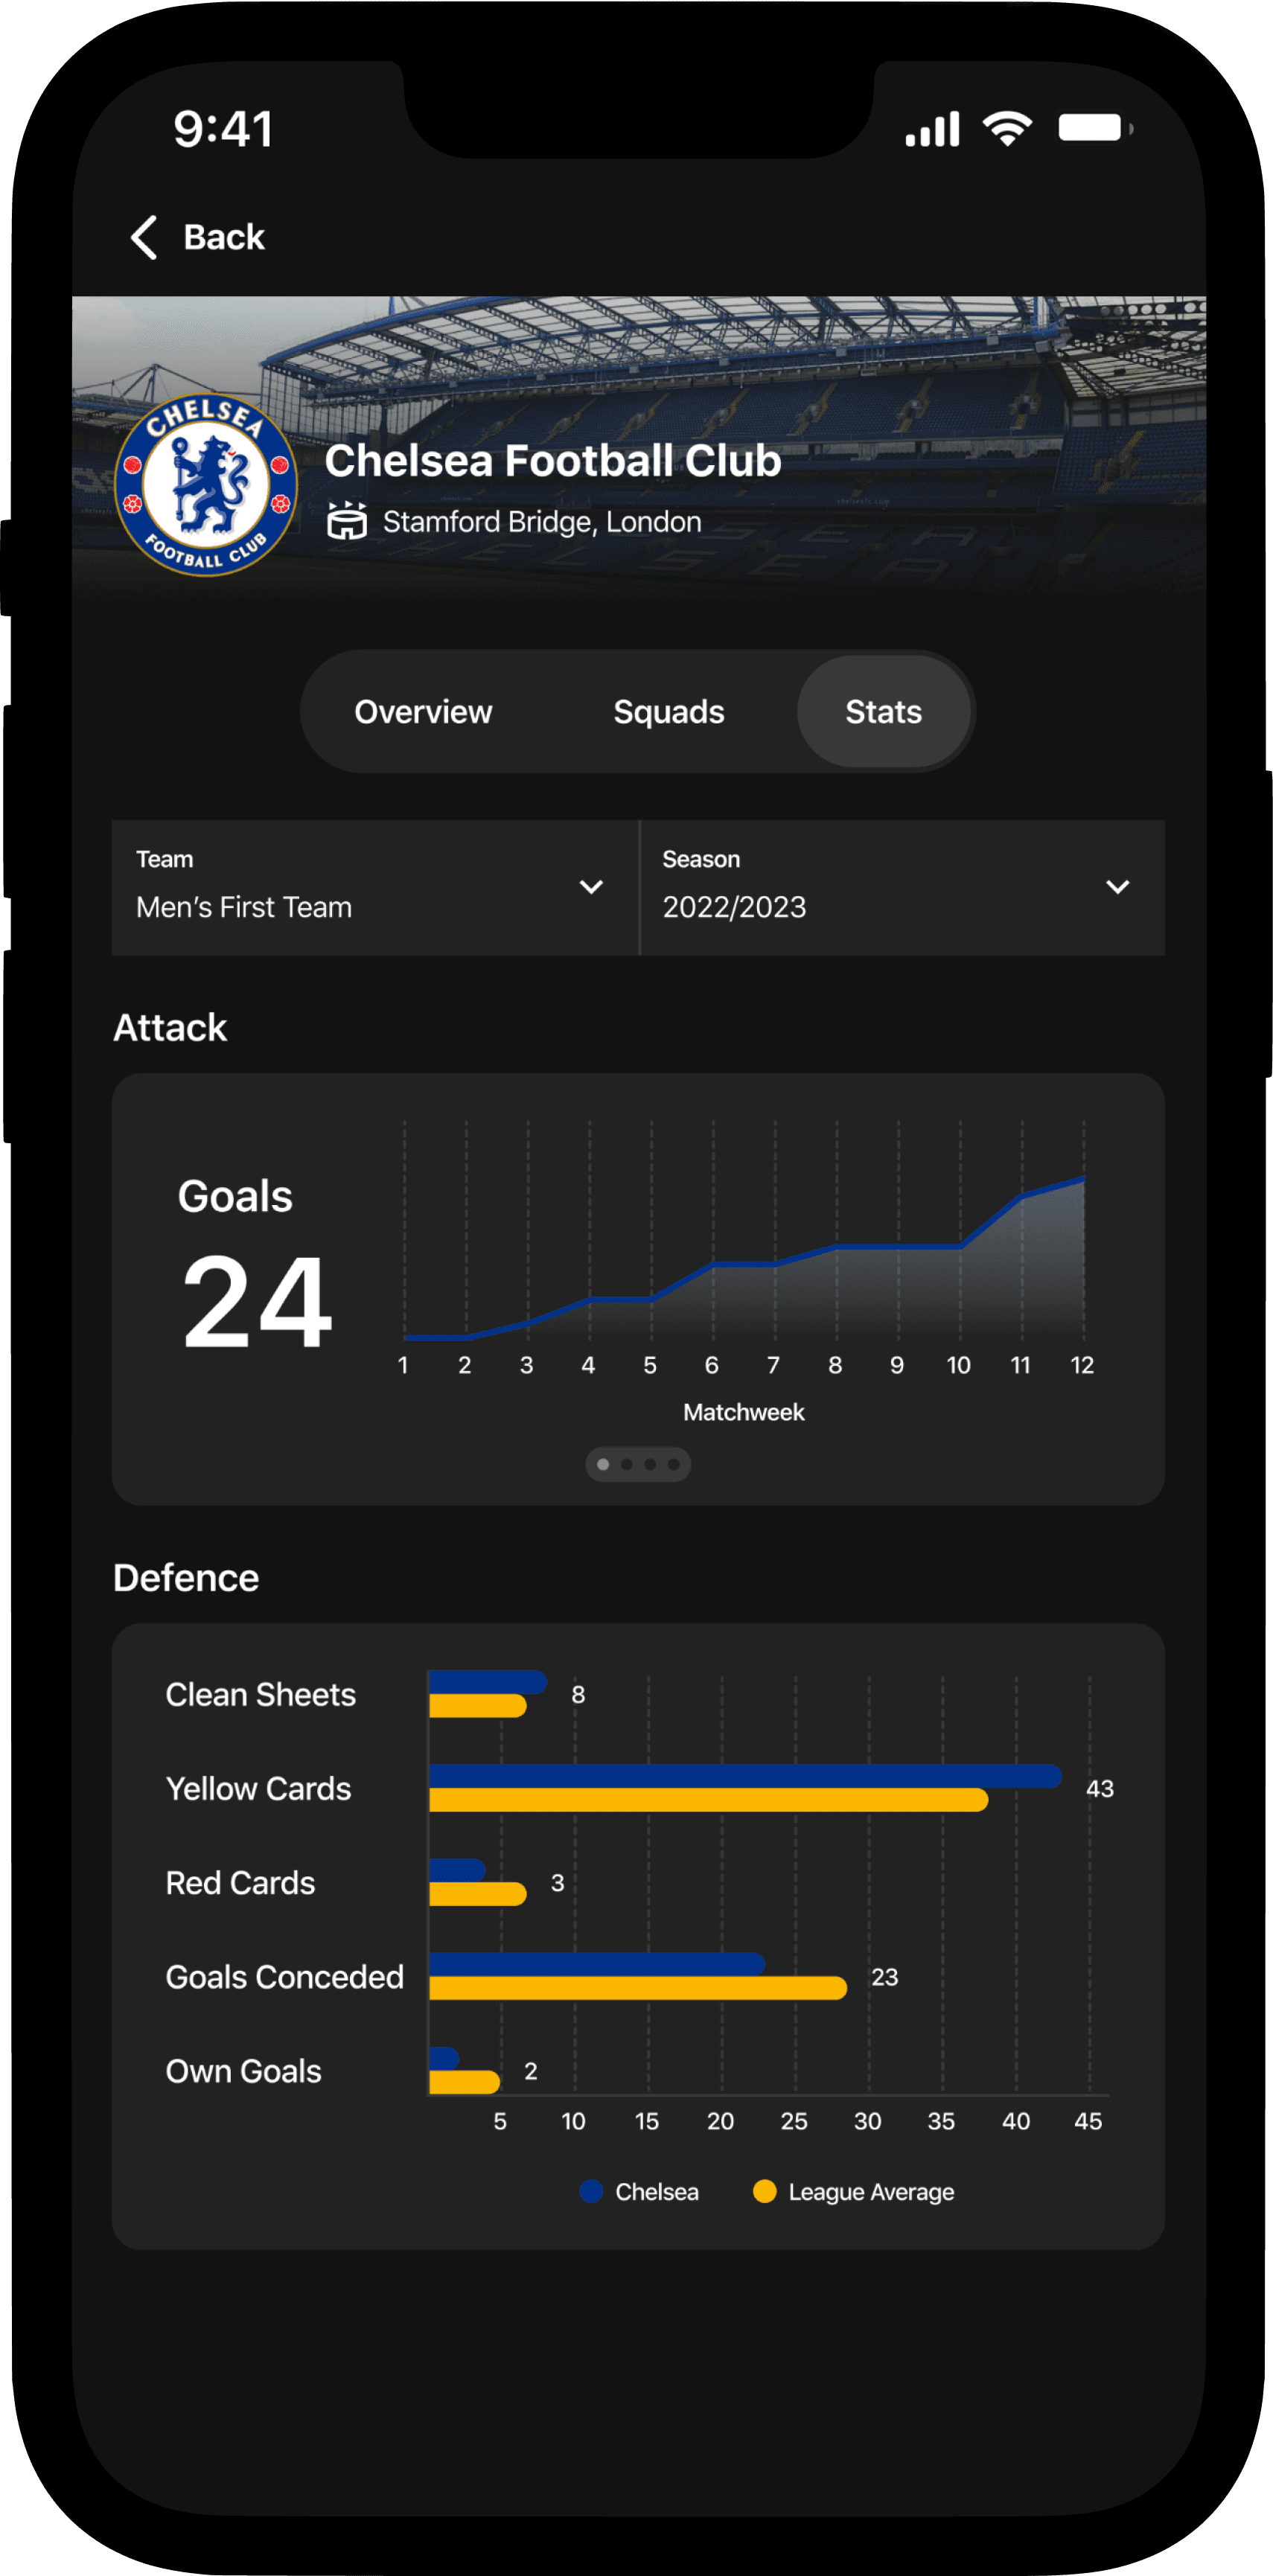
League Statistics
Next Project

VERTEx
A performance tracking app that utilises a groundbreaking technology.
Timeline
November 2022 - December 2022
My Role
Lead UX/UI Designer — Research, Visual Design, Interaction Design, Prototyping
Overview
Athlete tracking is a vital part of most sports, from grass-roots to professional level. The data collected holds the power to elevate performance, improve competitive advantage and engage fans.
In football specifically, athlete tracking currently relies on wearable sensors, these carry a host of pain points surrounding data type limitations and accuracy. Now, through AI, we are about to witness a revolution in the athlete tracking market.
Skills Developed
Figma
Wireframing
UIs for mobile and web
Prototyping and animation
Usability testing
Research
Communication with developers
RESEARCH
Game-changing insights.
The Performance Tracking Market
Lower cost solutions
Currently, the quality and quantity of wearable trackers required results in significant levels of investment.
Greater precision
Existing technologies provide valuable data, however, due to currently technology limitations, an abundance of key data is yet to be exploited.
Integration with other technologies
Many performance tracking solutions exist as standalone products, without integrating with other technologies or platforms and only benefiting those who operate the technology.
A User's Perspective
User-friendly interfaces
Many performance tracking solutions have complex interfaces that can be difficult for users to navigate and understand.
Access to data
Currently, consumers cannot openly access this pool of performance tracking. The data not only holds the ability to fascinate and increase engagement, but also inform decisions in the giant markets of gambling and fantasy sports.
SPATIAL AI
A new age of sports data.

Spatial AI allows computers to see the world as humans do, but better. Using high-resolution cameras, depth vision and on-chip machine learning, intelligent and accurate analytics are recorded. This highly demanded data can then be diffused live and recorded for athletes, performance analysts and the data hungry public.
What data can be recorded?
Familiar speed, distance, location, power movement and timing measurements we get from current wearables
Gameplay intelligence metrics
Receptions behind midfield and defensive lines
Expected goals (xG)
Ball recovery time
Forced turnovers
Defensive line height
Attacking, midfield and defensive units
Team lengths
Pressure on the ball
Final third entries
Line breaks
Biomechanics tracking for injury prevention
TARGET AUDIENCE
Who's in the game, And why.
Athletes and Coaches
Player Performance Analysis
Data surrounding athlete performance can offer valuable insights. The data can be analysed to identify areas of training and performance that need optimisation.
User Engagement
Fans love data-driven insights and analysis. The provision of real-time telemetry data means fans can be engaged in new and exciting ways.
Competitive Advantage
Using advanced analytics means that teams can identify patterns and trends faster and more effectively. This can help teams develop game tactics, adjust training programs and optimise overall performance.
Revenue Generation
The technology brings more potential for revenue generation through avenues such as user engagement, sponsorship and success on the pitch.
Consumers
Enhanced Fan Experience
Vertex provides real-time data on player performance directly to consumers. This data can enhance the fan experience by providing a greater level of insight into the game.
Fantasy Sports
By analysing the valuable performance data, fantasy sports fans can inform their decisions with much greater precision.
Betting
Bettors can also utilise the data to analyse athlete performance and game trends, increasing the likelihood for accurate decisions.
THE DESIGN PROCESS
Where problem solving and creativity meet.

User Persona

Wireframes

PLAYER COMPARISON FLOW
FINAL EXECUTION
Redefining football consumption.
Home and League Pages
On the initial interface, users can choose to view their preferred competition or team. Once within a competition, the user gains access to matchweek fixtures. Upcoming fixtures display kick-off times; live matches display scores, elapsed time and an option to view live action; and complete fixtures display the final score and a replay function. This interface also allows users to explore past and upcoming fixtures, along with the league table.

Home Page

Matchweek Fixtures

League Table
Live Match
When entering a live match, users encounter an expandable scoreboard that encompasses the game summary and a full-screen 3D interactive display of the fixture.
The interactive display, adapted to the home stadium, ensures an immersive experience. It showcases players' movements on the pitch and offers toggles to tailor the displayed content according to user preferences. This live match mode enables users to focus on specific players, accessing detailed live stats such as expected goals, work rate and pass completion. Users can also make player comparisons. General game stats, line-ups and live text are accessible via a collapsible overlay, providing valuable information for the target audience.

Live Match Landing

View Preferences

Player Focus

More Player Focus

Player Comparison

Match Statistics

More Match Statistics

Line-ups

Live Text
Live Match in Pro Mode
In addition to the standard portrait live match screen, users have access to the landscape alternative known as "Live Match Pro." This mode offers a more comprehensive view of on-pitch statistics via overlays. Users can access detailed data like possession, line breaks, final third entries and other advanced statistics for a more in-depth analysis.

Live Match Pro Standard View

Possession

Line Breaks

Final Third Entries

Build-up Play
Club Pages
Users can access comprehensive club-specific information via the club pages. This includes a wealth of data regarding upcoming fixtures, recent results, squads and various statistics.

Club Page Overview

Club Squads

League Statistics
